Option Chain
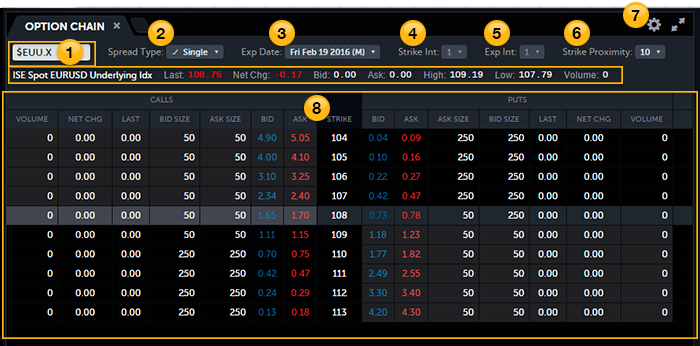
The Option Chain app displays single options and multi-leg spreads for the underlying equity or index symbol. Choose from multiple expiration dates and strike proximities. All values update in real time.
To view the Option Chain app
- Click the Layout Manager and choose Option Chain in one of the panels. Or, click any new tab icon
 and choose Option Chain.
 - Symbol link to the Option Chain app from the Trade Bar, or from the Quotes, Positions, or Orders apps.
Place a trade
You can place a trade directly from the Option Chain app; see Placing Options Orders.
Layout
 Symbol and Description
Click the word SYMBOL and type the first few letters of the symbol or the company name. The Symbol Lookup panel appears. Choose your asset class and symbol. The Option Chain app loads data from the underlying asset and displays the option chains.
 Spread Type
Click the Spread Type pull-down to select a single option, custom spread, or a spread type. The option chain updates the Strike price column and related Calls and Puts values to reflect the specified type.
- Spread Type Single: Click an individual Bid or Ask in the Calls column or Puts column and the order is copied to the Trade Bar. If you then click a different Bid or Ask cell, the new order replaces the previous order in the Trade Bar. Use Custom to select up to four legs.
- Spread Type Custom: Click up to four Bid(s) and Ask(s) in the Calls column or Puts column. You can have up to four legs. All legs must use the same underlying symbol, but they can have different expiration dates. You can also change the quantity of each leg on the Trade Bar. When you change the quantity, the Natural, Mid, and Far values automatically update.
- Other spread types: Click a Bid or Ask cell, and one or more leg(s) are automatically copied to the Trade Bar.
 Expiration Date
Choose the date that the option expires, and the asset's option term: (W)eekly; (M)onthly; (Q)uarterly; (E)nd of Month. If no value is shown, the term could not be identified. Calendar and Diagonal spreads show two expiration dates.
 Strike Interval
Adjusts the distance between strike prices when you have a spread that is composed of multiple strike prices. The option chain changes its spread construction, and the Bid and Ask prices automatically recalculate. For example: there are 3 strike prices (90, 95, 100). If the strike interval is 1 for a spread that is composed of multiple strikes, the strikes that would display in the strike price field are 90/95. If the strike interval is 2, the strikes that would display are 90/100.
 Expiration Interval
Adjusts the distance between the selected expiration dates. The option chain updates the spread construction based upon the selected value, and the Bid and Ask prices automatically recalculate. This filter is only enabled for Calendar and Diagonal spread types.
 Strike Proximity
Adjusts the number of options that display above and below the money. Choose the Strike Proximity that you want. For example, if you select 10, the option chain displays 5 options above and 5 options below the current strike price.
 Column Manager
Click the settings icon ![]() to access the Option Chain Column Manager. The Bid, Ask, and Strike columns cannot be removed. You can add, remove, and rearrange the other columns:
to access the Option Chain Column Manager. The Bid, Ask, and Strike columns cannot be removed. You can add, remove, and rearrange the other columns:
- Ask – The current offer or sale price of the call or put option.
- Ask Size – The number of contracts being offered for sale for each strike shown.
- Bid – The current bid price of the call or put option.
- Bid Size – The number of shares being offered for purchase for each strike shown.
- Close – The closing option price from regular trading hours.
- Delta – The Delta option sensitivity of the option.
- Extrinsic – The time value portion of the options price.
- Gamma – The Gamma option sensitivity of the option.
- High – The high price of the asset for the day.
- Imp Volatility - The volatility that is implied by the price of the option.
- Intrinsic – For calls: the intrinsic is max[underlying price - call strike price, 0). For puts: max[put strike price - underlying price, 0].
- Last – The last traded price of the option.
- Low – The low price of the option for the day.
- Net Change – The net change of the asset since the last daily close.
- Net Change % – The net change in percent since the last daily close.
- Open – The opening option price from regular trading hours.
- Open Int – The total number of open option positions for the specific option contract.
- Previous Close – The closing price from the previous regular trading session.
- Prob BE – The probability of breaking even at expiration.
- Prob ITM – The probability of expiring in-the-money for each single option.
- Prob OTM – The probability of expiring out-of-the-money for each single option.
- Rho – The Rho option sensitivity of the option.
- Theo Value – The theoretical option price.
- Strike – The option chain can show up to four strike prices.
- Symbol – The symbol for each option.
- Theta – The Theta option sensitivity of the option.
- Vega – The Vega option sensitivity of the option.
- Volume – The number of shares traded so far in the current day.
 Grid
Grid
When you choose a new underlying symbol, the old data clears and the grid updates to show the new data. Symbols sort in ascending order by strike price.
Option chain paused. Click to resume.
The option data streams continuously when you are moving your cursor over any portion of the Option Chain, entering a symbol, or selecting an Expiration Date or Strike Proximity. After 10 minutes of no activity in the Option Chain, the stream pauses. Click anywhere to dismiss the message and reactivate the stream.