Chart App
Charts show price activity for the specified symbol and time interval. Choose from different chart styles, add annotations such as trend lines, insert studies for more detailed analysis, or change the symbol and timeline.
You can also place a trade directly from a chart.
Use the Layout Manager to add more than one chart to your workspace. You can have up to five charts.
Overview
The following outlines the features in the Chart app.
- Enter the symbol that you wish to view.
- Select the interval and chart style, or adjust the chart's timeline.
- Insert drawings, annotations, or studies.
- View detailed bar data in the Data Tip.
- Create a symbol link from a chart to one of the other apps.
Layout
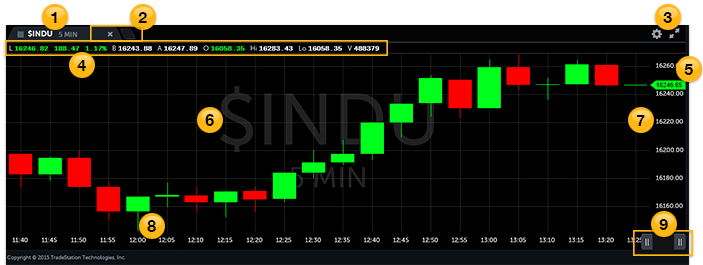
 Symbol/interval
View and change the chart symbol and chart interval here. Typing just the symbol leaves the interval as set. Changing the interval alone leaves the symbol as set.
- Change the symbol: Click and type. The symbol lookup panel appears. Choose an asset class and select a symbol.
- Change the interval: Click the interval, and a pull-down appears with the available choices. Or, enter a lookback period by typing a number. For example, enter 20 in the interval box and the chart will update with the selected value.
 Close chart/Add app
- Click the close icon x to close the chart app, and the App selector appears.
- Click the new tab icon
 and the app selector appears. Choose an app from the list. The new app appears in the same panel as the chart but on its own tab. To change the workspace layout, use the Layout Manager.
 Chart settings, Studies
- Click the settings icon
 for studies, Drawing, Chart Style, Orders, Chart Config, and Account. Change the default interval and lookback here. See Chart Settings for details.
 - Click the expand icon
 to maximize the chart. The arrows are blue when an app is maximized. Click again to restore the split view.
 - Press Ctrl+Shift+S to open the Add Studies dialog with hot keys.
 Status Line
The Status Line appears at the top of a price chart or subgraph. It displays information about the symbol and any studies that are applied to the chart. See Chart Settings or Adding Studies for more information on studies.

 Current price studies
Displays the current price for a price chart and current data for any studies.
 Price chart
The chart graphically shows how a particular symbol is performing over time. One or more studies, drawings, or data tips may overlay the price data. The current symbol and interval display in the chart background and on the tab.
 Y-axis, Price
The y-axis represents price in the appropriate currency. A subgraph will have its own y-axis scale.
 X-axis, Time
The x-axis represents time. By default, the chart uses the underlying price history that is in Chart Settings. The chart, studies, and subgraphs all reference the same x-axis.
 Chart scroll/Zoom
Use the time interval slider  to expand or shorten the time period that the chart shows. See Chart Config > Lookback to change the underlying price history data that is available. By default, the right slider is set to now.
- Drag the left slider to the left to see more of the price history data, or to the right to narrow the data range.
- Drag the right slider to the left to have the displayed time period end at some point in the past.
- Alternatively, use your mouse scroll wheel to zoom in and out. Use the left and right arrow keys on your keyboard to move the whole slider to the left or right.