Place a Trade from a Chart
You can place a trade from a chart using your own customized price point information. You can trade all of the asset types from a chart.
Overview
Data tips appear when you click and hold anywhere on the chart. Click the Buy or Sell buttons on the data tip to place a trade.
The trade buttons (Buy, Sell, Order Bar) do not display in the data tips for indices ($INDU, $DJI).
Placing a trade
To place a trade directly from a chart:
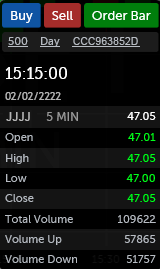
- Click and hold on a point in your chart; a data tip appears. The data tip shows your order entry settings, quantity and duration below the trade buttons. To change, click any of the values. The Order Entry Settings dialog opens. The account number on the data tip automatically follows the symbol's asset class.
- Click one of the order action buttons:
- Buy: When you click the Buy button, a buy order will be initiated with the details from the data tip. The Confirmation dialog will display. Click Send or Cancel.
- Sell: When you click the Sell button, a sell order will be initiated with the details that display on the data tip. The Confirmation dialog will display. Click Send or Cancel.
- Sell or Short: Whether Sell or Short will display depends on whether you own any shares of the symbol or not. If you own shares, Sell will display. If you do not own shares, Short will display. Click the Sell or the Short button to directly place an order, without the Trade Bar, using the values that are on the data tip.
- Trade Bar: The Trade Bar will load with the parameters from the data tip. The limit price will populate based upon the price where your cursor is in the chart.
- When you click Send, the order will appear in the Orders app. A Loading Orders message may also appear in the chart. The interval is 30 seconds.
Show/hide orders
By default, the chart shows orders. Use chart settings ![]() to show or hide orders. See Chart Configuration for details.
to show or hide orders. See Chart Configuration for details.
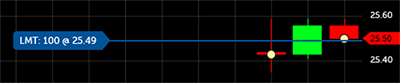
- After a trade is placed, an order flag displays on the chart as long as the order is open. The order flag has a line that points to the price on the y-axis. The flag displays the order type, the number of shares, and the limit price. When an order is canceled or expires, the flag disappears.
- If an order is outside of the chart's y-axis range, a marker will display. When the order is above the visible range, the open order flag will display at the top of the chart, with an arrow that points up. An order that is below the visible range will display at the bottom of the chart, with an arrow that points down.
- If multiple orders are so close that they would overlap, the orders combine into a multiple order box. Click the box to show the individual order flags. Click another location in the chart to dismiss.
- Filled orders display on the chart at the time and price the order fills. Filled orders will only display on the chart for the current day (until 21:25 PM EST for Equities). The filled order flags will display to the left of the bar where the trade took place.
- Open and filled orders display on a chart when the Orders app has refreshed. The default refresh rate is every 30 seconds. To manually refresh orders, open the Orders app and click on the refresh button.
- If you place an order early in the day and it scrolls out of view, adjust the x-axis with the sliders or use the arrow keys on your keyboard.
Cancel/replace an order
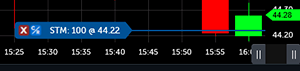
- If the order does not fill immediately, click the order flag on the chart to see the cancel and cancel/replace icons.
- To Cancel/Replace the order directly on the chart: If the order has not yet been filled, click the open order flag and drag it to a new price. As you drag the flag up or down, note that the price changes, and the horizontal line displays dots to show the price (y-axis). Drag the flag to the new price, and drop.
- Note: When you drag and drop an order flag on the chart, it is the equivalent of using Cancel/Replace, except that the Cancel Replace dialog does not appear. When you drop the flag on the new price, the original order will be canceled and replaced with the new order, automatically.
Trade click logic
When you place a buy or a sell order from a chart, the location where you click to initiate the trade determines the type of order and its settings (Order Type):
| Mouse Click | Order Action |
|---|---|
| Click buy when the selected price is above the ask | Buy Stop Market @ selected price |
| Click buy when the selected price is below the ask | Buy Limit @ selected price |
| Click sell when the selected price is above the bid | Sell Limit @ selected price |
| Click sell when the selected price is below the bid | Sell Stop Market @ selected price |