Chart Settings
From the Chart app, click Settings ![]() for tools to customize and provide more analysis for your chart.
for tools to customize and provide more analysis for your chart.
Click an item in the list, or scroll down.
  |
Studies |
  |
Drawing |
  |
Chart Style |
  |
Sessions |
  |
Orders |
  |
Chart Config |
  |
Account |
 Studies
Click Studies to access the Add Studies dialog and choose, configure, and add studies directly onto your chart. For a complete list of available studies, see the Study Library.
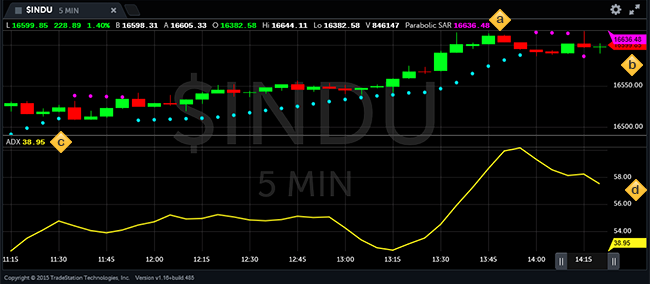
When you add one or more studies, the chart redraws to show the new studies. Depending on the study, it may plot on the same graph as the original chart, or it may plot on a subgraph. This example shows two studies: Parabolic SAR which displays on the same chart; ADX which displays on a subgraph.
- When a study's plot is on the same graph as the original chart, the study name and current value displays on the chart's status line.
- Study values display on the chart's y-axis but in different colors.
- When a study plots on a subgraph, the subgraph has its own status line that shows the study name and current value(s).
- The subgraph has its own y-axis when the scale is different. In this example, the x-axis slider bars have been moved to the left to see the historical data. The y-axis shows the correct range for the historical data, but the yellow flag shows the current value for the study and that the value is outside of the current y-axis range.
To remove one or more studies: Click the settings icon ![]() and choose Studies. Find the study in the Applied list, click the
and choose Studies. Find the study in the Applied list, click the  remove icon, and then click OK.
 Drawing
The drawing tools provide additional ways to view and analyze your chart data. When you click and drag the drawing tools, you will usually see data tips to make it easier to pinpoint where you want the drawing object to be. Note that lines, trend lines, and vertical lines will move with the chart over time and may scroll out of sight.
Line
With the Line tool, draw any vertical, horizontal, or angled line, anywhere on your chart. From the Drawing menu, choose Line. Click once for the start point of the line, drag the pointer to the end point, and then release. The line appears. A line is only applied to one graph. If you have studies on subgraphs within the chart, you can also add lines to the subgraphs.
To move a line:
- To keep the line the same size and angle but move to a new location: Click once on the line. The line has solid color selection dots. Click a solid dot, and then drag to the new location. The line remains unchanged.
- To make the line shorter or longer, or to change its angle: Click once on the line. The ends of the line have larger selection dots. Click the larger dot, and then drag either end of the line to extend, shorten, or change the angle.
Trend Line
A trend line is a momentum study. It measures the rate of increase in the share price over time and alerts you to any acceleration or deceleration of the trend. The difference between trend lines and other momentum studies is that you visually identify and draw the trend, rather than relying upon a calculated study.
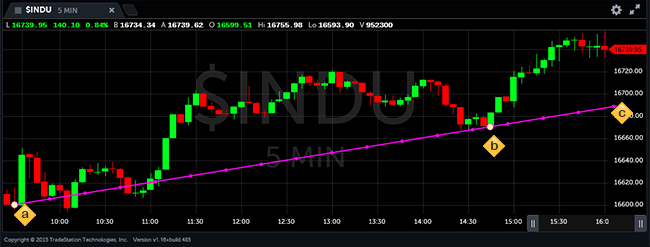
- Click once for the end point, and drag your pointer.
- Release the pointer to choose a midpoint.
- The end of the line will extend to the edge of the chart.
To move or modify a trend line:
- Move - To keep the line the same size and angle but move to a new location: Click once on the line. The line has solid color selection dots. Click a solid dot and then drag the line to its new location. The line remains unchanged.
- Modify - To make the line shorter or longer, or to change its angle: Click once on the line. Depending on how you drew the line, it may have only an end point, or end and mid-points. These show as large dots. Drag an end point, and a mid-point will appear. Drag either the end point or the mid-point to modify the line.
Vertical line
A vertical line is an analytical drawing tool used to identify a time and date on a chart. From the Drawing menu, choose Vertical Line. Click once where you want to insert the vertical line, and the line appears. A vertical line is only applied to one graph. If you have studies on subgraphs within the chart, you can also add vertical lines to the subgraphs.
To move the vertical line, click once on the line to select it, and drag the line to its new location. A vertical line cannot be at an angle, or shorter or longer. Use the Line feature for those settings.
Horizontal Line
A horizontal line is an analytical drawing tool used to identify support and resistance levels as well as highlight trading ranges. From the Drawing menu, choose Horizontal Line. Click once where you want to insert the line, and the line appears. A horizontal line is only applied to one graph. If you have studies on subgraphs within the chart, you can also add vertical lines to the subgraphs.
Unlike the other lines, a horizontal line perpetuates over time. Even though the chart will scroll left and right either with time or by changing the sliders, a horizontal line just stays in the same place on the chart.
To move the horizontal line, click once on the line to select it, and drag the line to its new location. A horizontal line cannot be at an angle, or shorter or longer. Use the Line feature for those settings.
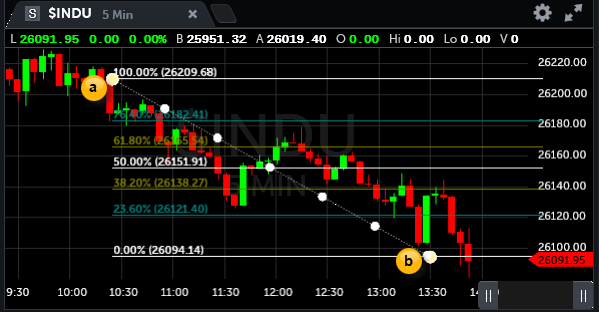
Fib Retracement
Fib Retracement lines are analytical drawing tools used to monitor support and resistance levels as well as breakout price activity. Support indicates a low or series of troughs where price activity has not penetrated. Resistance indicates a high or series of peaks where price activity has not penetrated. Identifying and monitoring these two levels can assist in determining whether a market will stay on course or reverse its course. Penetration through a support line or resistance line may indicate a market reversal.
Select the Fib Retracement drawing tool from the Settings ![]() menu.
menu.
- Click to set the initial point, and drag your pointer.
- Release the pointer at the opposite corner of the retracement area.
To modify or move fib retracement lines:
- Modify - To change the line spacing or object width: Click once on any fib retracement line. Large and small selection dots will appear on the dotted line. Click a large dot and then drag the point to a new location. The retracement line spacing changes.
- Move - To keep the line spacing the same but move the lines to a new location: Click once on any fib retracement line. Large and small selection dots will appear on the dotted line. Click a small dot and then drag the lines to a new location. The retracement lines remain unchanged.
Show, hide, and remove drawings
- Delete Selected- Click an object to select, and then choose Delete Selected to remove.
- Delete All- Removes all of the drawing objects, whether or not they are selected.
- Hide Drawings- All of the drawings are still part of your chart, but they are temporarily hidden.
- Show Drawings- Displays all of the drawings that were hidden. Note: Drawings might not display if they have scrolled out of the timeline.
 Chart Style
- OHLC - Displays the open, high, low, and close for each bar. For example, in a chart with a daily data interval, each bar shows the open, high, low, and close for that day's session.
- Area - Displays a line-on-close chart with the area below the line filled.
- Line - Displays a line that connects all the closing prices over the data interval period.
- Candlestick (default) - Uses the same price data as a bar chart, with each candlestick representing the open, high, low and closing price. The thick part of the candlestick is known as the real body and represents the range between the open and closing prices. The thin line (or wick) above the body represents the high, and the thin line below the body represents the low.
 Sessions
The following sessions are available:
- Regular Session Hours - 9:30 A.M. to 4:00 P.M. Eastern
- Pre Market Hours - 6:00 A.M. to 9:30 A.M. Eastern
- Post Market Hours - 4:00 P.M. to 8:00 P.M. Eastern
Choose the session to display on your chart:
- Regular Session Only - Displays the regular market session.
- Regular + Post Market - Displays regular and post market sessions.
- Regular + Pre & Post Market - Displays pre, regular, and post market sessions.
- Regular + Pre Market - Displays regular and pre market sessions.
Choose the shading to display on your chart:
- Show Shading - (Default setting) Displays shading in the pre and post market sessions.
- Hide Shading - Displays no shading in the pre and post market sessions.
The default setting for a newly opened chart is Regular + Pre & Post Market and Show Shading.
 Orders
Choose to show or hide your orders. By default, orders display on your chart. For more information, see Place a Trade from a Chart.
 Chart Config
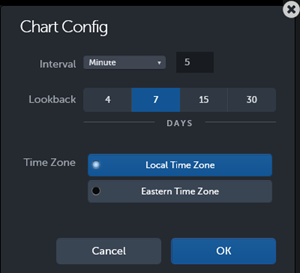
- Interval - Select the time interval for each bar (Minute, Daily, Weekly, Monthly). For Minute, enter the number of minutes per bar.
- Lookback - Select the number of days of price history data to be loaded into the chart.
- Time Zone - Select whether the chart will display in the user's local time zone or US Eastern Time.
Click OK to apply the specified settings, or click Cancel to exit without changes.
 Account
Click Account to view or select which account number will be used when you place a trade from a chart.
- Account shows all of your accounts for the asset class that is on the current chart.
- One of the account numbers will show a checkmark. This is the account number that will be used if you place a trade from the chart.
- To change to a different account number, go to Account and click the number that you want to use.
The default chart is an index, $INDU, so Account is greyed out on the menu. Change the symbol on the chart to an equities, options, futures, or forex symbol.
If you have any questions about your TradeStation account numbers, access the Client Center from the ![]() Help menu at the top of the screen.
Help menu at the top of the screen.