OptionStation Pro
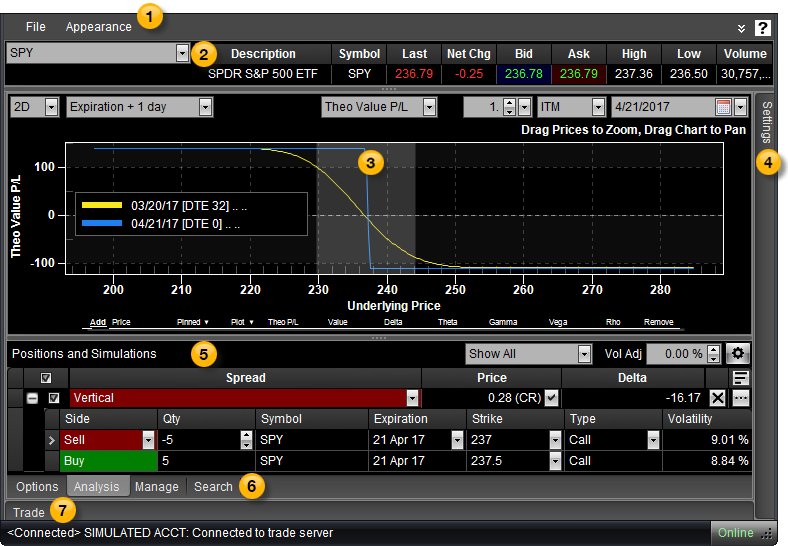
The Analysis Tab is where your positions and simulations are listed for analysis and graphing.
The tab contains the following features:
 Menu bar
The menu bar includes the File menu for saving your layout and settings, and the Appearance menu for changing the visual skin of OptionStation Pro based on different templates.
 Asset panel
The Asset panel shows data on the symbol for the underlying asset that you enter, and allows you to click on the Bid or Ask price to place a trade.
 2D/3D Risk Graph
The 2D or 3D Graph displays information about your current or simulated positions using a graph type you select (Theo Value P&L, Delta, Theta, Gamma, Vega, or Rho).
 Settings tab (panel)
The Settings panel enables you to adjust parameters for elements in the OptionStation Pro panels. This allows you to invoke what-if scenarios on your simulated and current positions. For example, you can change the pricing model, volatility, date ranges, and interest rates as well as graph the Greeks, then see the how these scenarios will play out in the 2D/3D Graph.
 Positions and Simulations panel
The Positions and Simulations panel is where your hypothetical positions are listed for analysis. Your simulated positions can be selected to track changes in time, asset price, and volatility, allowing you to see how your position's profitability will change in relation to changes in market conditions.
 Options, Analysis, Manage & Search tabs
The Analysis tab is displayed here. Click the Options, Manage, or Search tab to customize your trades.
 Trade Bar
After you click Buy or Sell, the OptionStation Pro Trade Bar will open. Your order will be automatically populated and ready to trade.