OptionStation Pro
The Settings panel enables you to adjust the way you view and work with options, including:
By default, the Settings panel is displayed in the upper right corner of OptionStation Pro. View the Working with Panels topic to learn how to move it.
Sections - The settings are grouped together into sections. The items in each section can be listed by clicking the down-arrows ![]() on the category title line to expand the list, or by clicking the up arrows
on the category title line to expand the list, or by clicking the up arrows ![]() to collapse the section.
to collapse the section.
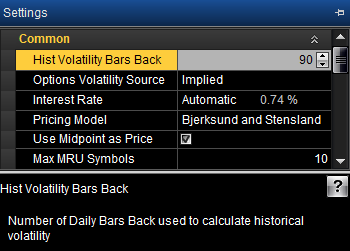
Mini-Help - Highlighting any item (such as Hist Volatility Bars Back, above) in the Settings panel will display a brief description for that item in the bottom section of the panel. You can resize the panel and drag the horizontal dividing line up or down to increase the size of the description.
The Common section lets you manage settings that apply to the source and calculation parameters for volatility.
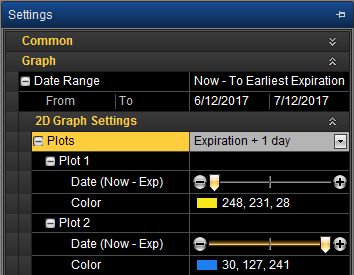
The Graph section allows you to define the view in your Risk Graph based on the parameters you select. This is a valuable tool in evaluating potential trades and testing how they would profit from market changes and time variables.
![]() Changing the From date redefines what is considered the Now date in other controls. Likewise, changing the To date redefines the Exp date.
Changing the From date redefines what is considered the Now date in other controls. Likewise, changing the To date redefines the Exp date.
The From and To dates display under the Date Range selected. To change the dates, you can either type in the dates (use MM/DD/YYYY), or use the calendar. Click the drop-down arrows next to a start and end date to display a calendar, and select the dates.
![]() The date at the top of the calendar shows today's date. The dates in the Settings panel are the From and To dates that you choose.
The date at the top of the calendar shows today's date. The dates in the Settings panel are the From and To dates that you choose.
The 2D Graph Settings is a sub-section of the Graph section that includes settings to control the number of plots and their appearance in the 2D Graph panel.
 or plus
  buttons at each end of the slider. This allows you to see how much a position can change within a specified time frame. For example, you may show one third to expiration for one plot and two thirds to expiration for the second one, giving a graphical view of how time decay affects your position as each plot progresses. The color and date of the plots will show in the legend.
Specifies the settings for option chains.