OptionStation Pro
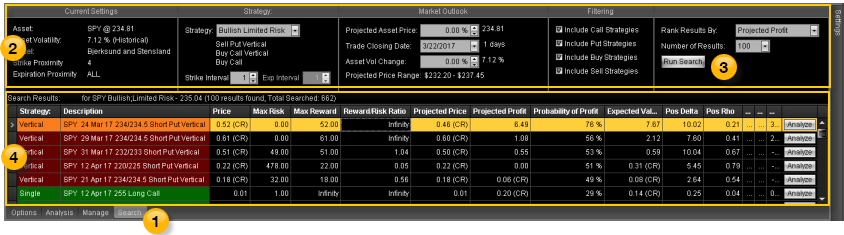
The Search Results panel is where you search for options to trade. You are able to define your own search criteria, perform a search, and compare the resulting spread candidates to find options that you believe are suitable for trading. To access this window, click the Search tab in OptionStation Pro.
 Search tab
Click the Search tab; the Search panel appears.
 Configuration
View and edit your search criteria for finding relevant option spreads for a specific asset. See below for more details on the different sections.
 Run Search
Once all of the configuration criteria are specified, click Run Search to provide search results.
 Results Grid
View the search results.
Current Settings Section
The underlying asset, volatility, pricing model, and proximity settings for your search.
Strategy Section
Lets you identify the type of market outlook or individual spread strategy to base your search on.
Market Outlook Section
Parameters used to define the price, expiration, and volatility conditions for your search.
Filtering Section
Use this section to determine the types of options to include in your results.
Run Section
Sets the ranking criteria and result size to display when clicking the Run Search button.
Columns for the Search Results can be added, removed, sorted, and repositioned. For more information, see Formatting Columns in OptionStation Pro.
Available columns for the Search Results include:
Strategy – The type of spread strategy.
Description – Describes the spread by the direction, symbol, option term, strikes, and option type (put or call) that it contains. Mini option spreads will display a (10) in the description field following the underlying asset, while standard-sized option spreads do not have the size listed.
Price – The current market price/premium of the position.
Max Risk – The maximum potential loss of the position.
Max Reward – The maximum potential gain for the position.
Reward/Risk Ratio – The ratio of the max reward divided by the max risk.
Projected Price – The price of the spread on the trade closing date after applying the user-supplied underlying price and asset volatility change.
Projected Profit – The profit of the spread on the trade closing date after applying the user-supplied underlying price and asset volatility change.
Probability of Profit –The probability that an option spread will be profitable by a fraction of a penny or more. It considers the probability of the underlying moving to asset prices that cause the spread to become profitable.1
Expected Value – The amount that the trader can expect to win or lose on average for each trade of the spread. The Expected Value is evaluated over an underlying price range of +/- 3 standard deviations. Throughout this range, the spread value at each underlying price is multiplied by the probability of the underlying moving to that price. Finally, all of the resulting products are added together to arrive at the Expected Value. The Expected Value may also be described as the Mathematical Expectation1.![]() 1 The book The Mathematics of Options Trading by C.B. Reehl (ISBN 0-07-144528-5) was used as a reference for calculating the probability related columns. A specific trading example can be found on pages 123 – 129.
1 The book The Mathematics of Options Trading by C.B. Reehl (ISBN 0-07-144528-5) was used as a reference for calculating the probability related columns. A specific trading example can be found on pages 123 – 129.
Pos Delta – The total Deltas of a position (single spread Delta * number of spreads in position * number of shares per contract).
Pos Rho – The total Rho of a position (single spread Rho * number of spreads in position * number of shares per contract).
Pos Theta – The total Thetas of a position (single spread Theta * number of spreads in position * number shares per contract).
Pos Vega – The total Vega of a position (single spread Vega * number of spreads in position * number of shares per contract).
Pos Gamma – The total Gammas of a position (single spread Gamma * number of spreads in position * number shares per contract).
Pos Delta Close Date – The total Delta of the position on the trade closing date after applying the user-supplied underlying price and asset volatility change.
Pos Gamma Close Date – The total Gamma of the position on the trade closing date after applying the user-supplied underlying price and asset volatility change.
Pos Rho Close Date – The total Rho of the position on the trade closing date after applying the user-supplied underlying price and asset volatility change.
Pos Theta Close Date – The total Theta of the position on the trade closing date after applying the user-supplied underlying price and asset volatility change.
Pos Vega Close Date – The total Vega of the position on the trade closing date after applying the user-supplied underlying price and asset volatility change.
Probability of Loss – The probability that an option spread will sustain a loss by a fraction of a penny or more. It considers the probability of the underlying moving to asset prices that cause the spread to sustain a loss. See note 1 above.
Qty – All spreads in the OptionStation Pro results grid are displayed on a one spread basis, therefore, the quantity is fixed at 1. Click Analyze to copy the spread to the Analysis tab. Once the spread is in the Analysis tab, quantity changes, spread analysis, and order placement can be performed.