Positions and Simulations Panel
The Positions and Simulations panel in the Analysis tab is where your current and simulated positions are listed for side-by-side analysis. Your simulated positions can be selected to track changes in time, asset price, and volatility, allowing you to see how your position's profitability will change in relation to changes in market conditions. This panel also lets you build spreads and view them for the selected underlying. When new single legs arrive in the panel, each is placed in a separate single spread. You can combine leg positions into named spreads using SpreadMaster.
Positions and Simulations Panel Layout
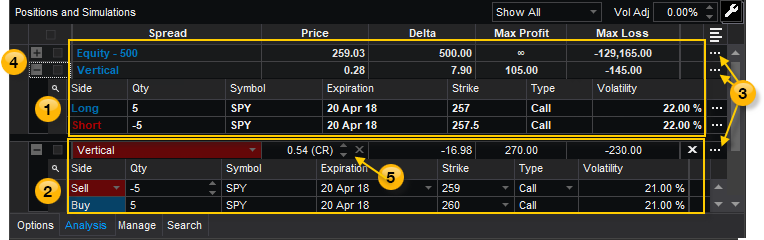
Your current positions and legs are shown above the divider, and your simulated positions are displayed below it. Only your simulated positions can be modified. The panel contains the following features:
 Current Positions
Current positions and legs are shown in the upper portion of the panel, above the divider. The text of the spread name and side label is colored blue for long and red for short.
 Simulated Positions
Simulated positions and legs are shown in the lower portion of the panel, below the divider. The background of the spread name and the side label cells is colored blue for long and red for short.
 Placing a Trade
Use the following controls to place and analyze trades:
- Show All drop-down list - Displays all of your positions, simulations only, or positions only.
- Volatility Adjustment text box - Enter the positive or negative percentage of volatility that will be added or subtracted to/from your positions and simulations. This may be useful to see the effect of volatility crush or expansion on your positions.
-
 (from a current position) - Select Close this Position, Roll this Position, Analyze Close, Analyze Duplicate, Create Empty Position, Merge Common Legs, Lock Position, Load Underlying Option Chain, or Copy Symbol.
 -
(from a simulated position) - Select Trade (send to the Trade Bar), Analyze Duplicate Trade, Analyze Opposite Trade, Delete Position, or Copy Symbol.
- X: - Deletes the position.
-
 - Select Delete All Simulations, Remove Expired Legs, Close Selected Positions, or Analyze Closing Selected Positions.
 Positions and Simulations Rows
The spread type is listed in a row (starting with a ![]() or
or ![]() ) and each leg of a spread is displayed beneath the spread type.
) and each leg of a spread is displayed beneath the spread type.
-
 - Expands the spread to display the legs in the spread position.
 -
 - Collapses the spread to hide the legs in the spread position.
 -
 - Displays next to each spread, enabling you to switch it on or off. Check the box at the top to select all spreads (selected by default). Check the boxes for each spread to view it in the 2D Graph or 3D Graph. By using the check boxes, you can see detailed analyses of your trade and review possible adjustments.
 Adjusting Spread Price
To adjust the price of a spread, click  . An X indicates you are manually adjusting the price. To switch between manual and market modes, click on the X icon. A check mark to the right of the column indicates that it is floating with the market price. Click the check mark to return to manual mode.
Positions and Simulations Columns
The columns at the top of the panel refer to the fields in each position row (those starting with a ![]() or
or ![]() ). To add more columns, click
). To add more columns, click ![]() and select Customize Columns.
and select Customize Columns.
Default columns (in order of appearance)
- Spread - Shows the type of spread being analyzed (Single, Vertical, Butterfly, Collar, etc.) and allows you to switch to Custom. This setting lets you customize any aspect of the spread and allows for spreads not included in the drop-down menu, such as unbalanced butterflies or condors. If you are trading shares of options, in addition to the spread type, the quantity, expiration term, strikes, and option type (put or call) may display in the summary row. If you are trading shares of equities, Equity may display followed by the quantity.
- Price - The current market price/premium of the position.
- Delta - The total Deltas of a position (single spread Delta * number of spreads in position * number of shares per contract).
- Max Profit - The maximum potential gain of the simulated position.
- Max Loss - The maximum potential loss of the simulated position.
Other available columns (in alphabetical order)
- Ask - The current ask (offer or sale price) of the call or put option for the spread.
- Ask Size - The number of contracts or shares being offered for sale for each position shown.
- Bid - The current bid price of the call or put option for the spread.
- Bid Size - The number of shares being offered for purchase for the displayed symbol.
- Gamma - The total Gammas of a position (single spread Gamma * number of spreads in position * number of shares per contract).
- Mid - The mid price is the average of the bid and ask prices.
- Mkt Value - The current market value of the simulated spread position. For options: (spread price * number of spreads in position * number of shares per contract). For equities: (stock price * number of shares).
- Notes - The custom note you define.
- Reward/Risk Ratio - The ratio of the max reward divided by the max risk.
- Rho - The total Rho of a position (single spread Rho * number of spreads in position * number of shares per contract).
- Risk/Reward Ratio - The ratio of the max risk divided by the max reward.
- Side - Allows you to edit the Side field by selecting Buy or Sell. Doing so will reverse the number of contracts from positive to negative or negative to positive depending on the original disposition of the legs. In addition, it will reverse the remaining legs in the spread to retain the integrity of the original spread type. If the spread type is set to custom, however, the changes made are isolated to the selected spread leg.
- Theta - The total Thetas of a position (single spread Theta * number of spreads in position * number of shares per contract).
- Underlying - The symbol of the underlying asset.
- Vega - The total Vega of a position (single spread Vega * number of spreads in position * number of shares per contract).
- Volatility - The value of the volatility calculation being used as the source to the options pricing model.
- Volatility Mode - The type of the volatility calculation being used as the source to the options pricing model.
Positions and Simulations Column Headers
The following column headers will display for both current and simulated positions:
- Side - Allows you to edit the Side field by selecting Buy or Sell. Doing so will reverse the number of contracts from positive to negative or negative to positive depending on the original disposition of the legs. In addition, it will reverse the remaining legs in the spread to retain the integrity of the original spread type. If the spread type is set to custom, however, the changes made are isolated to the selected spread leg.
- Qty - Displays the quantity of contracts in each leg. A positive number signifies that the contracts are Buy To Open (BTO), where a negative number shows the contracts are Sell To Open (STO).
- Symbol - Shows the symbol for each leg. You can copy your symbol to the clipboard. Refer to OSI Symbology in the glossary for full symbol definitions.
- Expiration - Displays the expiration term of each leg. The drop-down list in a leg provides other expiration terms that are available for that option.
- Strike - Displays the strike price of each leg. The drop-down list in a leg provides other strike prices that are available for that option.
- Type - The name of the option (equity, single, or spread type). Or, click the drop-down and choose custom. For more information, see Customizing a Spread.
- Volatility - Displays the volatility of each position leg.
Related Topics