3D Graph
The 3D Graph brings a whole new way to look at your option spreads by adding a visual dimension of time. It allows you to see the “landscape” of your trade given the Underlying Price, Profit and Loss (P&L), and Time.
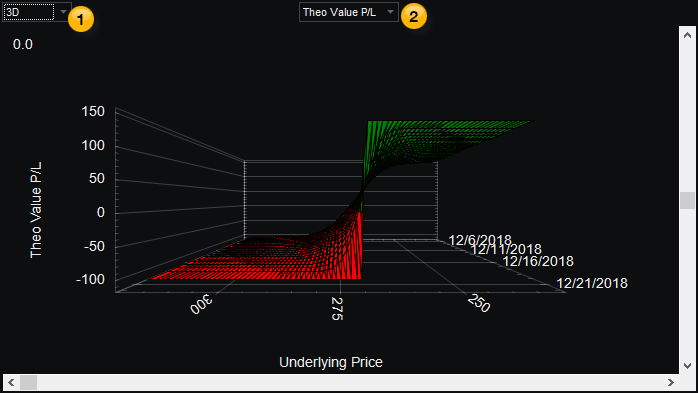
 To view a spread profile in 3D, select 3D from the drop-down menu
near the top of the Analysis tab.
To view a spread profile in 3D, select 3D from the drop-down menu
near the top of the Analysis tab.
To reposition the graph's view when using OptionStation Pro, use the scroll bars or drag the image using your mouse to create the desired view.
Setting up the 3D Graph
Use the following controls to set up the graph:
 Graph Dimension – To view a spread profile in 3D, select 3D from the drop-down menu.
 Graph Type – Contains a drop-down list of different types of data that can be plotted in the Risk Graph. You can choose Theo Value P&L, Delta, Theta, Gamma, Vega, or Rho to be plotted in the Y axis (along the left side) of the graph. Profit or Loss in dollars is also shown along the Y Axis. The underlying price is fixed on the X axis along the bottom, along with the asset price. The date is shown on the Z axis on the right side.
Viewing the 3D Graph
To access a 3D Graph feature, right-click on the graph and select one of the following:
Animate - Displays a continuously changing animation of different views.
Maximize - Re-sizes the 3D Graph to full screen mode. Clicking in the upper title bar will restore it to its original size.
Help (F1) - Accesses the help page for the current panel, the 3D graph in this case.