 About the Time & Sales Window
In the Time & Sales window you can monitor
If you choose real-time data, you can display a certain number of ticks, a certain time period (in minutes), or all ticks recorded for the day. If you choose historical data, which is useful for examining the history of a security, you can display tick data recorded for a specific day or for a specific day and time period (up to 5 days back). The Time & Sales window can also help you gauge the support and resistance of certain price points in addition to the volume behind each trade.
![]() To create a Time & Sales window, click the Time & Sales
To create a Time & Sales window, click the Time & Sales  icon on the Apps tab. A new Time & Sales window is displayed.
Layout

![]() A maximum number of 10,000 items may be displayed from the first requested date and/or start time.
A maximum number of 10,000 items may be displayed from the first requested date and/or start time.
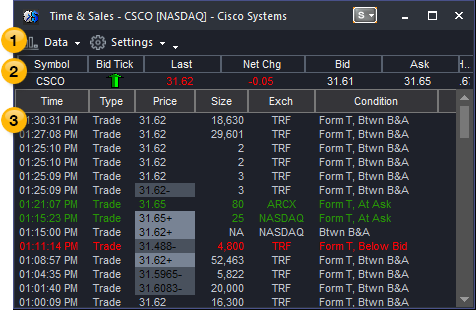
 Toolbar - Provides drop-down menus that control the features and settings of the window.
 Quote Bar - Displays only the best Bid and best Ask data for a symbol.
![]() Use the View > Quote Bar menu sequence to toggle the display of the Quote Bar. A check mark appears next to the Quote Bar menu item to indicate that it has been selected for display.
Use the View > Quote Bar menu sequence to toggle the display of the Quote Bar. A check mark appears next to the Quote Bar menu item to indicate that it has been selected for display.
 Detail Pane - The Detail pane shows time stamped quotes for each type of market event.
This provides detailed information in a column format: Time, Type, Price, Size, Exchange, and Condition. The most current market activity is shown in the top row. A new row is displayed for each trade, or when the price or volume of the best Bid or best Ask changes. Each event is displayed as a different color for easier viewing, as shown in the picture above.
![]() For Forex quotes, a referred value in the Condition column indicates that the price is provided for reference only. Referred quotes are ignored by TradeStation and cannot be used by TradeStation to trigger activation rules, strategies, stops, limits, or any other price based trade.
For Forex quotes, a referred value in the Condition column indicates that the price is provided for reference only. Referred quotes are ignored by TradeStation and cannot be used by TradeStation to trigger activation rules, strategies, stops, limits, or any other price based trade.
Related Topics
Changing the Symbol in a Time & Sales Window
Customize Symbol (Time & Sales)
Time & Sales Condition/Subtype Reference
Customizing Time & Sales Columns
Customize Window - General (Time & Sales)