OptionStation Pro
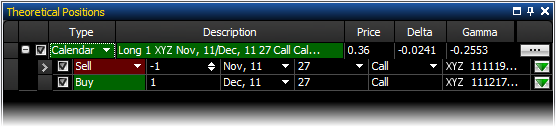
The Theoretical Positions panel is where your hypothetical positions are listed for analysis. Your theoretical spreads can be selected to track changes in time, asset price, and volatility, allowing you to see how your position's profitability will change in relation to changes in market conditions.
The panel layout contains columns and rows that provide you with detailed information for your theoretical spreads and spread legs. Columns can be sorted and rows may be edited depending on the information displayed.
The columns at the top of the theoretical position panel refer to the
fields in the each spread row (those starting with a ![]() or
or ![]() ). Columns for the Theoretical Positions
panel can be added, removed, sorted, and repositioned. For more information,
see Formatting Columns
.
). Columns for the Theoretical Positions
panel can be added, removed, sorted, and repositioned. For more information,
see Formatting Columns
.
The following is a list of all the columns that can be included in the Theoretical Positions panel.
(fixed columns)
Type – Displays the option or spread type.
Description – Describes the spread by direction, symbol, option term, strikes and option type (put or call) it contains. Mini option spreads will display a '(10)' in the description field following the underlying asset, while standard-sized option spreads do not have the size listed.
Price – Displays the price/premium of the spread.
(default columns)
Delta - Contains the Delta value in real-time of the spread. Delta measures how much an option will change in price in relation to a 1 point move in the underlying asset.
Gamma – Contains the Gamma value in real-time of the spread. Gamma measures the rate of delta movement.
(other available columns)
Max Reward - The maximum potential gain for the theoretical position.
Max Risk - The maximum potential loss for the theoretical position.
Reward/Risk Ratio - The ratio of the Max Reward and the Max Risk values.
Rho - The Rho value is a measure of the risk free interest rate change with each 1% move in the interest rate.
Side – Displays the position of the spread; Long or Short, Call, or Put.
Theta - The Theta value of the option measures time decay for each one day change in the option.
Underlying - Displays the symbol of the underlying asset.
Vega- The Vega value of the option measures the expected change in the option price due to a 1 percentage point increase in the volatility of the underlying asset.
The spread type you select (from the Options Chains panel) will determine
the rows displayed for each spread in the Theoretical Positions panel.
The spread type is listed in a row (starting with a ![]() or
or ![]() ) and each leg of a spread is displayed (indented)
beneath the spread type.
) and each leg of a spread is displayed (indented)
beneath the spread type.
![]() - Expands the spread
to display the legs in the spread position.
- Expands the spread
to display the legs in the spread position.
![]() - Collapses the spread to hide the legs in the spread
position.
- Collapses the spread to hide the legs in the spread
position.
![]() - Displays in each leg
enabling you to switch them on or off. Doing this will omit their
effect on the plot in the Risk Graph panel. It is very enlightening to
see the effect a single leg has on the spread, and a useful tool for evaluating
adjustment legs. Checking the boxes for your spread or leg will allow
it to be viewed in the Risk Graph. The above picture shows the Butterfly
trade selected. By using the check boxes you can see detailed analysis
of your trade and review possible adjustments by adding or subtracting
individual legs.
- Displays in each leg
enabling you to switch them on or off. Doing this will omit their
effect on the plot in the Risk Graph panel. It is very enlightening to
see the effect a single leg has on the spread, and a useful tool for evaluating
adjustment legs. Checking the boxes for your spread or leg will allow
it to be viewed in the Risk Graph. The above picture shows the Butterfly
trade selected. By using the check boxes you can see detailed analysis
of your trade and review possible adjustments by adding or subtracting
individual legs.
Columns headers for the Theoretical Position Rows can be added, removed, sorted, and repositioned. Right-click any leg row and select Show Column Headers to toggle the display of column names for the rows on or off. For more information, see Formatting Columns .
Symbol - Shows the full option OSI symbol for each leg. Refer to OSI Symbology in glossary for full symbol definition. Note: The symbol cannot be changed within the Theoretical Positions panel but will change due to changes in the Expiration Term, Strike, or Option Type columns. Note that a '7' at the end of the underlying asset indicates a mini option leg.
Side – Allows you to edit the Side field by selecting Buy or Sell. Doing so will reverse the number of contracts from positive to negative or negative to positive depending on the original disposition of the legs. In addition, it will reverse the remaining legs in the spread to retain the integrity of the original Spread Type. If the Spread Type is set to Custom, however, the changes made are isolated to the selected spread leg.
Qty - Displays the quantity of contracts in each leg. A positive number signifies that the contracts are BTO (Buy To Open), where a negative number shows the contracts are STO (Sell To Open).
Expiration - Displays the expiration term of each leg. The drop-down list in a leg provides other expiration terms that are available for that option.
Strike - Displays the strike price of each leg. The drop-down list in a leg provides other strike prices that are available for that option.
Type – Displays whether the options in the legs are Calls or Puts. You are able to edit the option type in the top leg from a drop-down list. When doing so, the associated legs will change accordingly to maintain the spread’s integrity. For more information, see Spread Construction.
Leg Price - Displays the price of each leg which is automatically set to the market price (default) from the option chain or manually by the user. If the leg price is set automatically by OS Pro, the price will either be current market mid price or market ask price depending on the status of the “Use Midpoint as Price” check box in the Settings panel.
A check to the right of a leg price indicates that the price is floating with the market price (market price mode). An ‘X’ indicates that the price is being manually adjusted by the trader (manual price mode). Price spinners are provided for adjusting the price while in the manual price mode.
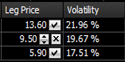
To switch between automatic and manual leg price modes, the trader needs to click on the check icon or ‘X’ icon located in the right hand side of the leg price column.
Volatility - Displays the volatility of each spread leg. This volatility is calculated from the leg price displayed in the leg price column.
SPC - The Shares Per Contract (SPC) column displays the contract specific deliverable. Most equity options have 100 shares per contract. For the recently added mini options, the shares per contract will be 10. ![]() Note that non-standard options are restricted from being loaded into the Theoretical Positions panel. Closing non-standard options are allowed from the Real Positions panel.
Note that non-standard options are restricted from being loaded into the Theoretical Positions panel. Closing non-standard options are allowed from the Real Positions panel.
![]() -
Allows you to send the leg to the Order Bar. Selecting Send
as Open to Order Bar initiates a new leg; Send
as Close to Order Bar closes an existing leg; or Deleting
Leg deletes the leg.
-
Allows you to send the leg to the Order Bar. Selecting Send
as Open to Order Bar initiates a new leg; Send
as Close to Order Bar closes an existing leg; or Deleting
Leg deletes the leg.
 - Allows you to trade or delete the entire spread,
in the same manner as the individual spread legs but sends the entire
spread to the Order Bar at once.
- Allows you to trade or delete the entire spread,
in the same manner as the individual spread legs but sends the entire
spread to the Order Bar at once.
Analyzing a Trade
To analyze and plot the selected option spread in the 2D or 3D Graph, select the desired check boxes associated with each spread type or spread leg. You are able to include one or more spreads at the same time to be plotted. For more information on graphs, see 2D Graph and 3D Graph.
Click
![]() to display
the legs for the selected spread. This allows you to view the parameters
that make up that position – most typically this will be the legs in an
option spread but can also include shares of stock.
to display
the legs for the selected spread. This allows you to view the parameters
that make up that position – most typically this will be the legs in an
option spread but can also include shares of stock.
Click
![]() to hide the legs for the selected spread.
to hide the legs for the selected spread.