Settings
Click the Settings ![]() button on the upper right of the Asset panel in the upper right corner of OptionStation Pro to open the Settings dialog.
button on the upper right of the Asset panel in the upper right corner of OptionStation Pro to open the Settings dialog.
The Settings dialog enables you to adjust the way you view and work with options, including:
- Appearance settings, including skin templates and font size.
- Common options attributes, including Volatility, Interest Rates, and Pricing Model;
- Risk Graph settings, including 2D graph plots;
- Option Chain display parameters; and
- Order account settings.
Tabs - The settings are grouped together into tabs. The items in each tab can be viewed by clicking the tab on the left to expand the list.
Mini-Help - Adjusting any item (such as Hist Volatility Bars Back, above) in the Settings dialog will display a brief description for that item in the bottom section of the dialog. Click on the ? button to view the OptionStation Pro help system.
Reset - Select the Reset button on any tab to restore the default settings for that tab only. Select the Reset All button on the bottom of the dialog to restore the defaults for all tabs.
Appearance
The Appearance tab lets you change the visual 'skin' style of OptionStation Pro based on different templates, as well as change the font size.
Click a 'skin' image to immediately change the foreground and background colors of the entire OptionStation Pro desktop.
Use the Font Size drop-down list to select the desired font size from the available choices. You must restart OptionStation Pro for the new font size to take effect.
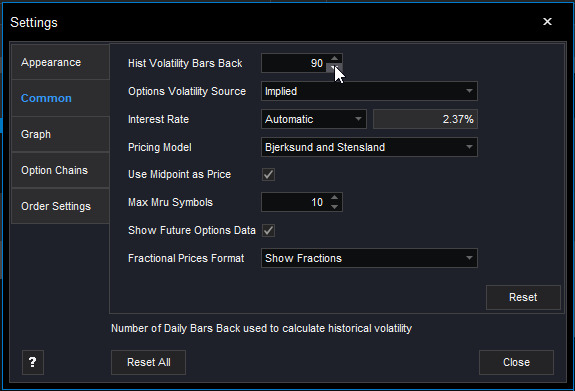
Common
The Common tab lets you manage settings that apply to the source and calculation parameters for volatility.
- Hist Volatility Bars Back - Adjusts the number of closing prices used to calculate historic volatility (select between 20 - 250).
- Options Volatility Source - Contains a drop-down list that lets you select Implied volatility (IV) or IV Skew Approximation. Changing this setting affects the plot(s) of the Risk Graph before expiration and the Price Point values.
- Implied (default) - Uses Implied Volatility as calculated from the current option price.
- IV Skew Approximation - Uses an approximation technique to create a volatility curve that fits the current implied volatility values within a given expiration term.
- Interest Rate - Contains a drop-down list that lets you select a fixed or automatic rate and a text box to enter the percentage.
- Pricing Model - Contains a drop-down list that lets you select the Bjerksund-Stensland (default) or the Black-Scholes model for option pricing, sensitivity, and volatility calculations.
- Use Midpoint as Price - Check this box to use the midpoint price for volatility calculations, or leave it unchecked to use the natural prices.
- Max MRU Symbols - Adjusts the maximum number of Most Recently Used (MRU) symbols displayed in the symbol lookup (select between 0 - 40).
- Show Futures Options Data - Check this box to display data for futures options in the options chains panel. Note that a
 will appear to the left of the Symbol box on the top line of OptionStation Pro when this item is checked.
 - Fractional Prices Format - Contains a drop-down list that lets you select how fractional prices will be displayed.
Graph
The Graph tab allows you to define the view in your Risk Graph based on the parameters you select. This is a valuable tool in evaluating potential trades and testing how they would profit from market changes and time variables.
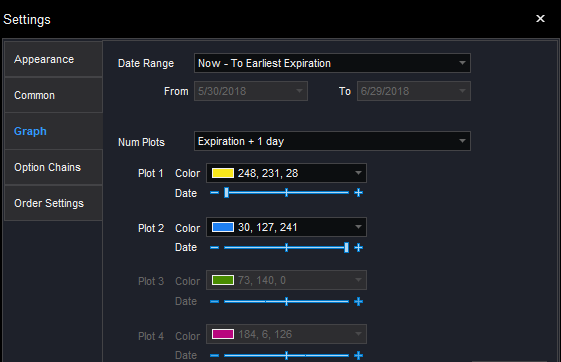
- Date Range - Controls the amount of time the graph that will have available to plot. Now - To Earliest Expiration is the default. However, you can select Now - To Latest Expiration or Custom.
 Changing the From date redefines what is considered the Now date in other controls. Likewise, changing the To date redefines the Exp date.
The From and To dates display when the Custom Date Range is selected. To change the dates, you can either type in the dates (use MM/DD/YYYY), or use the calendar. Click the drop-down arrows next to a start and end date to display a calendar, and select the dates.
The date at the top of the calendar shows today's date. The dates in the Settings dialog are the From and To dates that you choose.
- Num Plots - Allows you to draw up to four plots representing four different dates between now and the date of expiration. Select Expiration + 1 day to display two plots (one plot will show today's risk curve and another the risk curve at expiration), Expiration + 2 days to display three plots, or Expiration + 3 days to display four plots. This gives you a graphical view of how time decay affects your position as each plot progresses. The number of plots you select will be reflected in the Analysis tab on the Risk Graph.
- Plot Slider Control - Each plot has its own slider control, allowing you to fine tune the date of each plot. You can move a plot incrementally with the slider control using the minus
 or plus
  buttons at each end of the slider. This allows you to see how much a position can change within a specified time frame. For example, you may show one third to expiration for one plot and two thirds to expiration for the second one, giving a graphical view of how time decay affects your position as each plot progresses. The color and date of the plots will show in the legend.
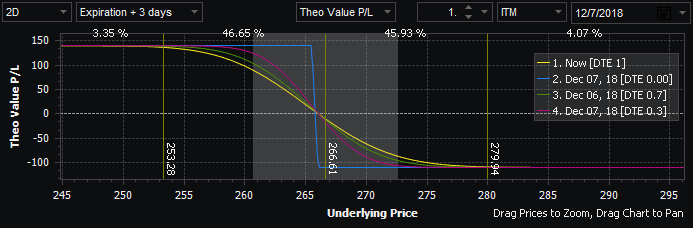
 - Plot (n) Color - Each plot automatically uses a different color. Click on the Color control to choose your preferred color. Below is a Risk Graph. The dates for each plot and their colors correspond to the lines on the chart:
Option Chains
The Option Chains tab lets you adjust the following settings:
- Expected Move Calculation - Aligns the expected move to fit closer to a standard deviation range. Select pessimistic for a longer range or optimistic for a shorter range.
- Pessimistic - Provides an expected move based on the standard formula: stock price * implied volatility * √ (days to expiration/365).
- Optimistic (default) - Modifies the pessimistic factor to provide a value that has been tested to be closer to a one standard deviation move (68% on a normal distribution curve).
- Price Updating - Specifies the frequency that prices and calculations are updated. Choices include:
- Fast (default) - approximately every second.
- Medium - approximately every 2 seconds.
- Slow - approximately every 3 seconds.
- Decimal Places for Greeks - Specifies the number of decimal places for Greeks columns (2-4).
- Max Futures to Load - Specifies the maximum number of futures contracts to show in the asset panel when a futures root symbol is selected from the Symbol box in the Asset panel.
Order Settings
The Order Settings tab lets you adjust the following setting:
- Show Quantity Multiplier - Check this box to apply a multiplier to the quantity of each leg on the Trade Bar. For more information, see the Trade Bar topic.