Matrix Price and Volume
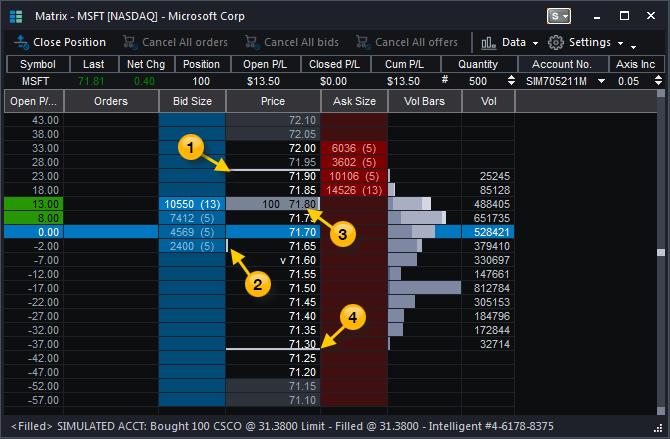
The Matrix window displays symbol-specific market depth information in the Bid Size, Price, Ask Size, and Volume columns. Each column includes color coded cells that allow you to view key price and volume levels at a glance. For information about position values, see Matrix Positions.
| Feature | Description |
|---|---|
| Ask Size | The current Ask Size is displayed is this column for each price level. The number of market participants for each ask level is shown in parentheses to the right of the number of ask shares/contracts. As asterisk (*) in front of an ask value indicates that there is fractional price improvement included within that ask level. |
| Price (Price Scale) |
The Price column displays the price scale for the selected symbol, and uses color coded cells to identify traded prices between the high and low of the day. The price increment, by default, is based on the symbol's minimum price increment. By compressing (or increasing) the axis increment, the price column is condensed which allows a larger range of prices to be displayed in the price scale. |
| Bid Size | The current Bid Size is displayed in this column for each price level. The number of market participants for each bid level is shown in parentheses to the right of the number of bid shares |
| Vol Bars (Volume at Price Level) |
The Vol Bars column displays color-shaded activity bars that let you identify what volume occurred at each price level during the session. Activity bar shading is the darkest at the start of a session and becomes progressively lighter throughout the session, in half-hour increments. A blank volume cell within the days trading range indicates that no trades occurred at that price level.
|
 High High |
The High price marker appears on the top edge of the cell containing the highest price of the trading session. Also, the cell color of prices above and below the High marker are typically different. |
 Open Open |
The Open price marker appears on the left edge of the cell containing the opening price of the trading session. |
 Last Last |
The Last price is represented by a shaded price cell that also includes the share |
 Low Low |
The Low price marker appears on the bottom edge of cell containing the lowest price of the trading session. Also, the cell color of prices above and below the Low marker are typically different. |