 Subsession Hi-Lo Lines (Indicator)
Input Information
| Name | Expression | Default | Description |
| NumSubSessionsAgo | Numeric | 1 | The number of sessions ago to reference. |
| StartTimeHour_HH | numeric | 09 | The starting hour of the period to reference. |
| StartTimeMin_MM | numeric | 30 | The starting minute of the period to reference. |
| StartTimeSec_SS | numeric | 00 | The starting second of the period to reference. |
| EndTimeHour_HH | numeric | 16 | The ending hour of the period to reference. |
| EndTimeMin_MM | numeric | 00 | The ending minute of the period to reference. |
| EndTimeSec_SS | numeric | 00 | The ending second of the period to reference. |
Market Synopsis
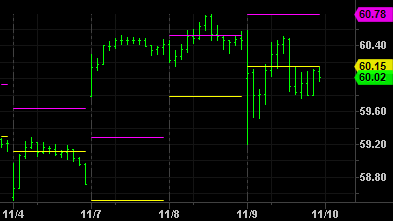
The Subsession Hi-Lo Lines indicator plots the period high and period low for a specified time period ago. By default, it's set to plot the high and low of the previous day's regular session (9:30:00am - 4:00:00pm est). Changing the period start time to 10:00:00 and the end time to 13:00:00 would display the high and low during that time period, N sessions ago.
Plot Information
| Number | Name | Default Color | Description |
| Plot1 | SubSessHigh | Magenta | The high price of N session days ago during the specified period. |
| Plot2 | SubSessLow | Yellow | The low price of N session days ago during the specified period. |
Related Function