 Subsession OHLC (Indicator)
Input Information
| Name | Expression | Default | Description |
| NumSubSessionsAgo | Numeric | 1 | The number (N) of sessions ago to reference. |
| StartTime_HHMMSS | string | "09:30:00" | The starting time of the period to reference. |
| EndTime_HHMMSS | string | "16:00:00" | The ending time of the period to reference. |
| ShowOpen | numeric | 1 | Set to 1 to display Open line; 0 to not display. |
| ShowHigh | numeric | 1 | Set to 1 to display High line; 0 to not display. |
| ShowLow | numeric | 1 | Set to 1 to display Low line; 0 to not display. |
| ShowClose | numeric | 1 | Set to 1 to display Close line; 0 to not display. |
| OpenColor | numeric | red | Color to use for Open line. |
| HighColor | numeric | magenta | Color to use for High line. |
| LowColor | numeric | yellow | Color to use for Low line. |
| CloseColor | numeric | cyan | Color to use for Close line. |
| ShowTextLabels | numeric | 1 | Set to 1 to display text labels on lines; 0 to not display. |
| TextLabelFontSize | numeric | 8.0 | Font size for the text labels on the lines. |
Market Synopsis
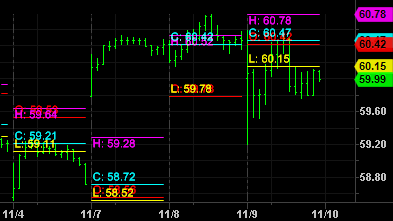
The Subsession OHLC indicator plots lines at the Open, High, Low, and Close of the number of session ago (NumSubSessionsAgo) for a specified time period in each session. By default, it's set to plot the lines of the open each day's regular session (9:30:00am - 4:00:00pm est) based on the previous session prices. Changing the period start time to 10:00:00 and the end time to 13:00:00 would display the open, high, low, and close during that time period, N sessions ago.
Plot Information
| Number | Name | Default Color | Description |
| Plot1 | Open | Red | The opening price of N session days ago during the specified period.. |
| Plot2 | High | Magenta | The high price of N session days ago during the specified period.. |
| Plot2 | Low | Yellow | The low price of N session days ago during the specified period.. |
| Plot2 | Close | Cyan | The closing price of N session days ago during the specified period.. |
Related Function