About ActivityBar Studies
ActivityBars are a powerful, innovative type of study.
ActivityBar studies provide you with look inside-a-bar technology, which
enables you to display and analyze transactions that occurred within each
bar on your chart. You have access to plot trade-related information, such as volume-at-price, overlaid on standard time-based
price bars of any data interval. You define the time frame of the bar
chart you create, and then, using an ActivityBar study, break that time
frame into smaller increments, or "cells."
There are several built-in ActivityBar studies and each provides you with
a different type of analysis. You can also create your own study
using EasyLanguage in the TradeStation Development Environment. Just like other
studies, ActivityBar studies are written using inputs, which
means you can customize the studies as you apply them to a chart.
How ActivityBars Work
To illustrate how ActivityBar studies work, we'll use the built-in "Price Distribution"
ActivityBar study. This ActivityBar study enables you to create a 10-minute
bar chart, for example, but also allows you to see the prices at which
most of the trading occurred, overlaid directly on the 10-minute chart.
When you add and customize the ActivityBar study, you define the size
of your ActivityBar cells by specifying the data interval to use. In this
example using a 10-minute price chart, you can choose 1-minute, 2-minute,
or 5-minute data interval. The 1-minute interval will give you ten cells
(10 minutes divided by 1 minute equals 10 cells); the 2-minute interval
will give you five cells (10 minutes divided by 2 minutes equals 5 cells);
and the 5-minute interval will give you two cells (10 minutes divided
by 5 minutes equals 2 cells). The idea is to choose a data interval for
your ActivityBar study that is divisible into the interval of the underlying
price chart (in this case, 10 minutes).
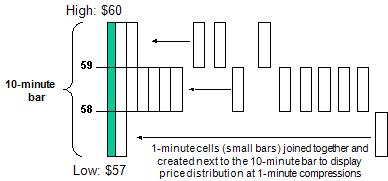
Let's say you add the Price Distribution ActivityBar study in your
10-minute chart and set its data interval to 1-minute. Each 1-minute time
unit will be displayed as a cell on one side of the 10-minute bar to reflect
where the closing price fell during that period of time (by default, the
cells will display to the right of the bar). Each additional cell is created
consecutively, reflecting the position of the closing price during the
next time unit, until enough cells are created to total the time frame
of the bar. In this example, there will be a total of ten 1-minute cells
for the 10-minute period.
The figure below illustrates how a typical ActivityBar is built. As
you can see, the ActivityBar study enables you to pinpoint the most heavily
traded price point within that bar (in this example, 58 to 59).
In the above example, we specified an ApproxNumRows of 3. ApproxNumRows
is the input for all ActivityBar studies that allows you to specify approximately
how many rows you want the study to build. In this case, since we specified
three rows and the trading range is 57 to 60, all closing prices between
57 and 58 will be grouped together. You can specify more rows if you want
to break down the data even further. You can change virtually all aspects
of an ActivityBar study; for example, whether or not to display the cells,
the individual colors of the cells, and more, depending on the individual
study.
Each of the built-in ActivityBar studies provides a different type of
analysis, and you can customize these studies to display the way you want;
however, the concept of how the ActivityBars are created is the same.
Due to their construction, ActivityBar studies may not be applied to
tick or Point & Figure charts. Also, like a trading strategy, you
can only apply one ActivityBar study to a chart at a time, and the ActivityBar
study is always applied to Data1. You cannot specify the subgraph in which
you want to display the ActivityBar study; the ActivityBar study is always
applied in the subgraph along with Data1.
Also, to accommodate the cells, the open and closing prices are identified
with larger arrows, which you can choose to display using the customizing
options.
![]() See
ActivityBar
Study Library for detailed descriptions and illustrations of each
ActivityBar study.
See
ActivityBar
Study Library for detailed descriptions and illustrations of each
ActivityBar study.
Related Topics
Adding an Activity Bar to a Chart
Changing the Colors Used for ActivityBar Cells