OptionStation Pro
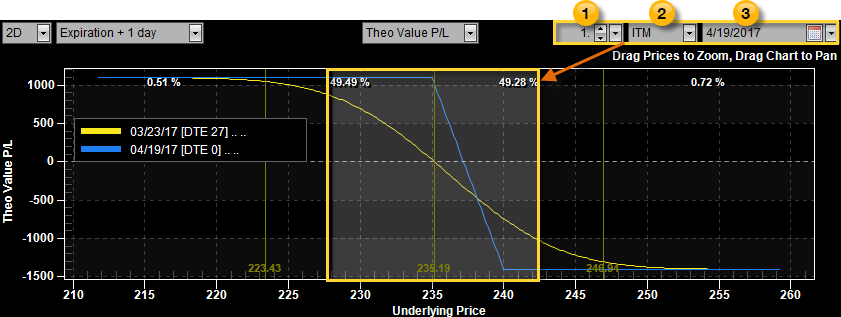
The Probability Shade displays on a 2D Graph to show the range of prices based on the specified number of standard deviations.
The probability shade is drawn based on the following parameters:
 The number of standard deviations you select in the Probability Standard Deviations control.
 The selection you choose in the Probability ITM/OTM control. Select ITM to highlight the area that is in-the-money, or OTM to highlight the area that is out-of-the-money.
 The date that you select in the Probability Date control.
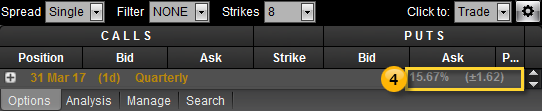
 The average implied volatility, as reflected in the Options tab.