TradeStation Help
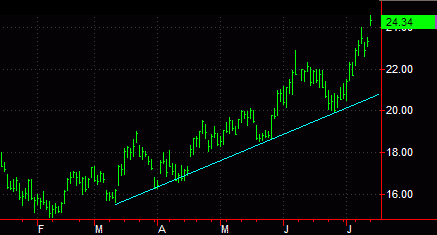
A trendline is an analytical drawing tool used to track market direction. Trendlines assist in identifying trend breakouts indicating buy or sell opportunities (trendlines are not useful in forecasting market activity) by determining the slope of a trend. Trendlines allow you to easily visualize where a market's price was, is, and where it is going. When a market begins moving away from its current direction (trend), a trend reversal might take place. Often, analysts draw several trendlines on a chart as time progresses in order to monitor up and down market corrections.

You can also use the shortcut menu for a selected object to change the drawing properties such as color, style, weight, and any object specific settings.
Trendlines are commonly drawn along the highs or lows of price activity. In an uptrend, trendlines are commonly drawn underneath rising lows (troughs) or, in the case of a downtrend, drawn above declining highs. Trendlines usually include all price activity and touch the troughs or peaks two to three times.
Drawing objects are applied to a chart to assist with data analysis. See About Drawing Objects for more details.
After a Trendline is applied to a chart, you can reposition the drawing object at any time.
A trendline can be extended to the left or right.
| Option | Description |
|---|---|
| Freestyle | Allows you to draw a Trendline in any angle and in any position you choose. You can reposition a freestyle Trendline without any restrictions. |
| Extreme | Attaches a positive sloping Trendline to the lowest low of the beginning bar and to the highest high of the ending bar included in the Trendline. Attaches a negative sloping Trendline to the highest high of the beginning bar and the lowest low of the ending bar included in the Trendline. When repositioning or increasing/decreasing bar spacing, Trendlines based on extreme values will always attach to the lowest low and highest high of the appropriate bars. |
| Fixed Point | Attaches to a specified price on the beginning and ending bars of a Trendline. For example, selecting Open draws the Trendline from the open of the beginning bar of the Trendline to the open of the ending bar of the Trendline. When repositioning or increasing/decreasing bar spacing, a fixed point Trendline will always attach to the appropriate fixed point setting. To create a Trendline based on fixed points, use the Fixed Point drop-down menu to select the appropriate bar price: open, high, low, or close. |
| Regression | Draws a linear regression line based on the bar price selected for all bars included in the Trendline. This regression calculation is also known as the Best Fit method. For example, selecting Open plots a linear regression line based on the opening prices of all bars included in the Trendline. When repositioning or increasing/decreasing bar spacing, a linear regression line will always recalculate based on the linear regression settings. To create a Trendline based on linear regression calculations, use the Regression drop-down menu to select the appropriate bar price to calculate the linear regression line: open, high, low, or close. |
| Screen Angle | Draws a Trendline to the screen angle you specify. When repositioning this Trendline, it will maintain its specified angle. Since this Trendline is not mathematically calculated, the Trendline will not recalculate when increasing/decreasing bar spacing. Therefore, it is recommended that Screen Angle be used strictly as a visual tool. To create a Trendline based on a screen angle, enter the appropriate angle in the Screen Angle box. |
| Gann Angle | Draws a Trendline based on specified time (Run) and price (Rise) values. Run is represented by the number of bars while Rise is represented by the number of points the Trendline rises (increases along the y-axis) per bar. For example, a Trendline with a Rise of 2 and a Run of 1 has a 2 to 1 price to time ratio. Therefore, for every bar, the Trendline increases in price two points. For a Trendline with a Rise of 1 and a Run of 8, the Trendline increases 1 point for every 8 bars. When you reposition or increase/decrease bar spacing, a Trendline based on Gann Angles will recalculate to maintain the Rise and Run ratio, keeping the slope constant. |
![]() Remember to keep your Rise and Run values within the price and bar range of your Trendline.
Remember to keep your Rise and Run values within the price and bar range of your Trendline.
You can easily lengthen a Trendline so that it extends to the left or right of its original placement. When you extend a Trendline, its slope remains constant but the length is extended. So, if you wanted to apply a Trendline to future bars, you would extend the Trendline to the right. Conversely, if you wanted to apply the Trendline to additional historical bars, you would extend the Trendline to the right.
Formatting the Alerts of a Drawing Object
Formatting the Labels of a Drawing Object