TradeStation Help
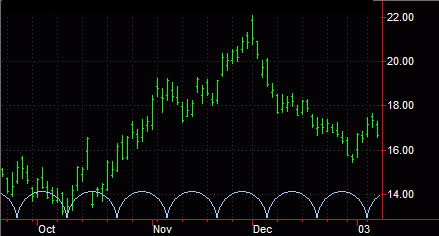
A Time Cycle is an analytical drawing tool used to identify cyclical price activity - repeating high and low price patterns. Cycle analysis is based on the premise that a market's price activity behaves in patterns. Therefore, future price activity can be predicted by identifying historical price patterns. It can be difficult identifying a cycle and may require analyzing years of data. Once you identify a repeating price pattern, the Time Cycle can assist you in determining the time intervals between those patterns.
Identifying cycles can provide insight as to how long a particular trend or pattern will continue. Analysts following cycles believe when a cycle bottoms (reaches its trough), an up trend will follow until the cycle tops out (reaches its crest). Once the crest is reached, a downtrend continues until the cycle reaches its trough and the cycle begins again.
Time Cycles are similar to Fibonacci Cycles in that they both interpret historical price movement patterns. The main difference between these cycle analysis tools is the method used to determine distances between cycles. Time Cycles use equal distances between cycles while Fibonacci Cycles use the Fibonacci number system to determine the distances between cycles.
The Time Cycle identifies trends and trend reversals. It is often used in conjunction with other analysis techniques to determine the stability or the end of a cycle.

You can also use the shortcut menu for a selected object to change the drawing properties such as Color, Style, Weight, and any object specific settings.
Drawing objects are applied to a chart to assist with data analysis. See About Drawing Objects for more details.
After a Time Cycle is applied to a chart, you can reposition the drawing object at any time.
Using this tab, you can choose to display a Time Cycle as a series of arcs or lines.
You can also use the shortcut menu for a selected object to change available settings.
Formatting the Alerts of a Drawing Object