 About the Chart Analysis Window
TradeStation Help
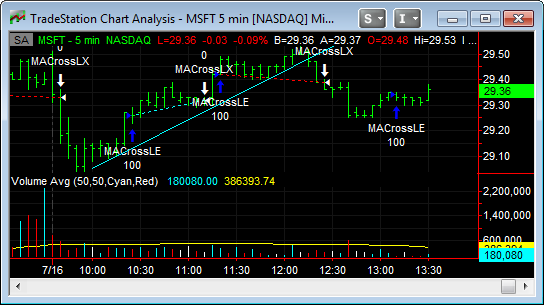
About the Chart Analysis WindowChart Analysis windows are used to display price charts, perform technical analysis, back-test and automate strategies, and see open and filled orders for the charted symbol. You can create several charts within the same workspace, and you can add multiple symbols to a single Chart Analysis window.
![]() Click the Chart Analysis
Click the Chart Analysis ![]() icon in the TradingApps window, and a new Chart Analysis window displays.
icon in the TradingApps window, and a new Chart Analysis window displays.
Creating a Chart Analysis Window; Inserting Analysis Techniques in a Chart or Grid Window; Formatting a Chart Analysis Window
Using Chart Trading (trading from a Chart); About Account Orders & Positions
Creating a Multi-Data Chart; Removing a Symbol from a Multi-Data Chart; Overlaying Symbols on a Chart
Changing the Vertical Axis Settings on a Chart
Clicking and Dragging in a Chart
![]()
Refreshing TradeStation Windows
Printing Windows and Documents
![]()
![]()
![]() Similar functionality is available in the Mobile and Web Trading versions of TradeStation.
Similar functionality is available in the Mobile and Web Trading versions of TradeStation.