TradeStation Help
Overlaying Symbols on a Chart
When a symbol is added to a chart, it can either be displayed in its own sub-graph or overlaid with one or more other symbols on the same sub-graph. Overlaying multiple symbols on a sub-graph allows you to see relative price movements of the symbols during the same time period.
- Activate a Chart Analysis window containing at least one symbol.
- From the Menu bar, click Insert > Symbol. The Insert Symbol dialog is displayed.
- Type a symbol name in the Symbol box or select one from the drop-down list.
- Place a check mark in the Prompt for format box to make format options for the symbol.
- Click Plot.
The Chart Analysis window will now display the symbols plotted in the chart:
- From the Format Symbol [symbol] window, select the Scaling tab.
- Under Axis, from the Scale On drop-down list:
- From the Sub-graph drop-down list, select 1 to have the symbol displayed in sub-graph #1. If you want to display multiple symbols in another sub-graph, use the appropriate number instead.
- Click OK to plot the new symbol on sub-graph #1.
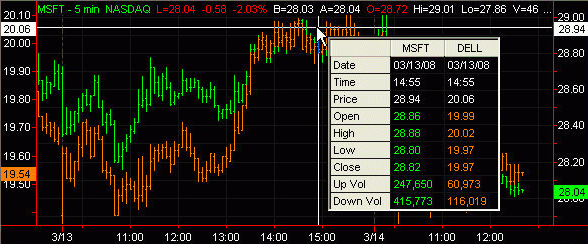
The second symbol plots in a different color and automatically scales itself so that it overlays the first symbol even though the scales are not the same.
- To see underlying price details for each charted symbol, click near a bar (not on a bar) and move the cross hairs so that the vertical line aligns with a bar interval. The Data Tip window shows separate columns for each symbol including the date and time of the selected bar along with related data.