Fibonacci Price Retracement Lines Drawing Object
Price Retracement Lines are analytical drawing tools used to monitor support and resistance levels as well as breakout price activity. Support indicates a low or series of troughs where price activity has not penetrated. Resistance indicates a high or series of peaks where price activity has not penetrated. Identifying and monitoring these two levels can assist in determining whether a market will stay on course or reverse its course. Penetration through a support line or resistance line may indicate a market reversal. Support and resistance lines can also be used in conjunction with Percent Retracement analysis to identify past trend correction patterns. These patterns can then assist in predicting future patterns.
You can also use the shortcut menu for a selected object component (identified with small squares) to change the drawing properties such as color, style, weight, and any object specific settings.
Drawing a Fibonacci Price Retracement Lines Object
Drawing objects are applied to a chart to assist with data analysis. See About Drawing Objects for more details.
- Activate a Chart Analysis window.
- Use the Drawing > Fibonacci Price Retracement Lines menu sequence. Your pointer will change to the shape of Retracement Price Lines object.
- Click where you want to begin drawing the Price Retracement Lines.
- Move your pointer up, down, left, or right to position the drawing object, then click again to add. For significant results, Price Retracement Lines should be drawn between a high and low point of price activity on a chart.
- Optional. Use the Drawing > Snap Mode menu sequence to "snap" the drawing object to the open, high, low, or closing price of the first and last bars the drawing object intersects. For more information, see Snap Mode.
Moving a Fibonacci Price Retracement Lines Object
After Fibonacci Price Retracement Lines are applied to a chart, you can reposition the drawing object at any time.
- Activate a Chart Analysis window containing a Fibonacci Price Retracement Line object.
-
- Drag either square (located at the end of the underlying trendline) to change the slope of the underlying trendline as well as lengthen or shorten the distance between support and resistance lines. The trendline pivots along the opposite end of the trendline selected. Dragging any part of the Fibonacci Retracement Price Lines, with the exception of the squares, allows you to move the Fibonacci Price Retracement Lines horizontally and vertically without changing the underlying trendline's length or slope.
- Optional. Use the Drawing > Snap Mode menu sequence to "snap" the drawing object to the open, high, low, or closing price of the first and last bars the drawing object intersects.
Customizing Price Retracement Lines Settings
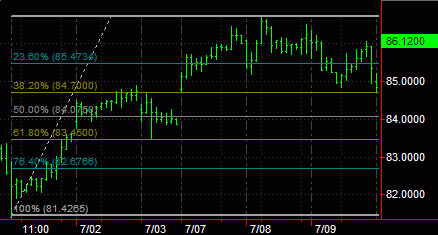
Price Retracement Lines are drawn using an underlying trendline. These lines intersect the trendline at specified percentages of the distance between the beginning and end points of the trendline. For example, a 50% line intersects the trendline at its midpoint. You can use this tab to modify support/resistance lines by specifying their percentage as well as other properties.
- Activate a Chart Analysis window containing a Price Retracement Lines (Support/Resistance) object.
- Right-click on any of the Fibonacci Price Retracement Lines. Select Edit 'Fibonacci Price Retracement Lines' from the shortcut menu.
- Click the Settings tab.
- Under Percentage, select a check box to enable the display of the trendline and each parallel price line.
- Enter a percentage, in decimal format, in the box corresponding to the selected check box. This value determines at what point a support/resistance line intersects the underlying trendline.
- Under Extend, select Left check box to extend the support/resistance lines to the left and select the Right check box to extend the support/resistance lines to the right.
- In the drop-down lists, select a Line Color, Line Style, and Line Weight for each segment.
- Select the Set as Default check box to use these settings as the default for all future support/resistance lines.
- Click OK.
You can also use the shortcut menu for a selected object to change available settings.
Related Topics
Customizing the Alerts of a Drawing Object
Customizing the Labels of a Drawing Object