Horizontal Line Drawing Object
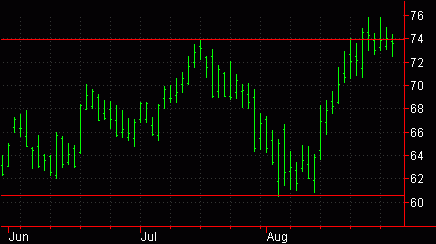
A horizontal line is an analytical drawing tool used to identify support and resistance levels as well as highlight trading ranges. You can apply horizontal lines to a chart whose price data remains within a specific trading range. A Horizontal Line drawn at the bottom of the price range is the support line. A Horizontal Line drawn at the top of the price range is the resistance line. These Horizontal Lines delineate a price channel in which the market trades. If either of these lines is penetrated and the market continues in that same direction, a price breakout may have occurred. Although the Horizontal Line is an analytical tool, you should apply other studies to confirm price breakouts.
You can also use the shortcut menu for a selected object to change the drawing properties such as color, style, weight, and any object specific settings.
Drawing a Horizontal Line Object
Drawing objects are applied to a chart to assist with data analysis. See About Drawing Objects for more details.
- Activate a Chart Analysis window.
- Use the Drawing > Horizontal menu sequence. The pointer will change to the shape of a Horizontal Line object.
- Click where you want to add the Horizontal Line.
- Optional. Use the Drawing > Snap Mode menu sequence to "snap" the drawing object to the open, high, low, or closing price of the bar to which the horizontal line is applied. Although a horizontal line is not applied to just one bar, the Snap mode feature uses the bar perpendicular to your pointer when the horizontal line is drawn to determine the first bar. For more information, see Snap Mode.
Moving a Horizontal Line
After a horizontal line is applied to a chart, you can reposition the drawing object at any time.
- Activate a Chart Analysis window containing a horizontal line object.
- Select the Horizontal line (a small square at the center of the line confirms the drawing object is selected) and drag vertically to reposition the Horizontal line.
- Optional. Use the Drawing > Snap Mode menu sequence to "snap" the drawing object to the open, high, low, or closing price of the bar to which the Horizontal line is applied. Although a Horizontal line is not applied to just one bar, the Snap mode feature uses the bar perpendicular to your pointer when the Horizontal line is drawn to determine the first bar.
Setting an Alert for a Horizontal Line
A quick way to set a price alert at a specific level in a chart is to enable an alert on a horizontal line drawing object.
See Enabling Alerts for Studies and Drawing Objects for more information.
Related Topics
Customizing the Alerts of a Drawing Object
Customizing the Labels of a Drawing Object
Customizing the Style of a Drawing Object