 About Chart Analysis
The Chart Analysis window is used to graphically display price data, perform technical analysis, back-test and automate strategies, and show orders and positions for a specified symbol. Chart analysis windows are created and saved as part of a workspace allowing multiple chart windows to be combined with other tool windows in each workspace.
![]() To create a Chart Analysis window, click the
Chart Analysis
To create a Chart Analysis window, click the
Chart Analysis  icon from the Apps tab, or use the Main File > New Application > Chart Analysis menu sequence. A new Chart Analysis window is displayed.
![]() VIDEO - Creating a Chart Analysis Window
VIDEO - Creating a Chart Analysis Window
Chart Window Layout
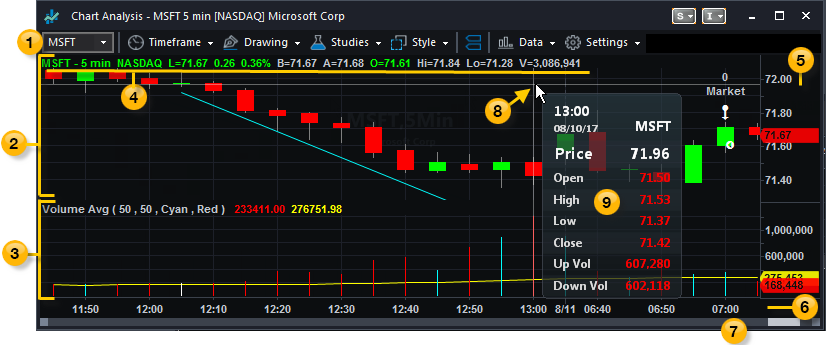
The main portion of the chart window displays the price chart with its status line and associated price and time axes. You can scroll the chart left and right to view price history and use the crosshairs pointer (with DataTip) to review details for a selected bar and price point. Sub-graphs may appear beneath the price chart if you have added studies or price data for other symbols.
The following numbered items refer to features in the picture (above):
 Toolbar
Provides drop-down menus that control the features and settings of the window.
 Price Chart
The price chart displays a series of bar values that summarize market prices based on the trading interval selected for the current chart symbol. Trading intervals can be time-based (5 minute, 30 minutes, daily, etc.), activity-based (ticks, volume), or price-based (Point-and-Figure, Kagi, etc.). You can select the bar style (OHLC, candlestick, line-on-close, etc.) used to represent the interval as well as choose custom display settings such as color, line type, etc.
 Sub-graph
A sub-graph will appear beneath the price chart for each applied study that requires its own price axis scale, such as volume or a reference indicator such as ADX. Sub-graphs are also used to display additional symbols or intervals. A maximum of 16 sub-graphs can appear in the chart window. See Working with Sub-graphs for more information.
 Status Line
A status line appears at the top of each price chart and subgraph. It displays information about the symbol and/or studies and strategies applied to the chart or subgraph. For example, for a symbol you will see the name, interval, and exchange along with it's current prices, bid-asks, session high-lows, and volume. For studies and strategies you will see each listed by name along with a summary of its input settings and plotted values. For more information, see Chart Status Line.
 Price Axis
The price axis (y-axis) of the chart window displays the range of prices for the symbol in a price chart and any plotted values in a subgraph.
 Time Axis
The time axis (x-axis) shows the time scale (interval) of the bars displayed in the chart window.
 Scroll Bar
The horizontal scroll bar appears when a price chart contains bar data that does not fit in the current chart window. Drag the scroll bar slider to the left or right to view more bars, or use the left/right arrow keys to perform the same function. The up/down arrows keys are used to change the bar spacing, allowing you to control the number of bars that are visible in the chart window.
 Crosshairs
On a chart, the pointer's location is indicated by the intersection of crosshair lines. The vertical and horizontal position of the pointer is indicated on the vertical and horizontal chart axes where the crosshair lines intersect the axes. Settings to control the display of the crosshair lines and the associated Data Tip are available in the Chart Analysis Preferences dialog's Display tab. See also: About Pointers.
 DataTip
The DataTip shows information relative to the position of the pointer in a price chart or subgraph. For example, when the mouse button is clicked near a particular bar in a price chart, a summary of that bar's prices and volume is displayed along with the values of any studies applied to that set of bars. For more information, see Viewing Price Data in the DataTip.
Chart Analysis Tools
A variety of charting tools can be applied to a chart to help you measure and analyze market movement, backtest and manage rule-based trading, and monitor orders and current positions.
Studies
Studies are used to evaluate historical and real-time market data. Applying a study to a chart provides you with a visual method of monitoring and measuring the symbol's price movement and financial performance. Studies can be an Indicator, ShowMe, PaintBar, ActivityBar, ProbabilityMap and Study Groups. For more information, see About Studies.
Strategies
Strategies consist of a set of rules that can be based on price movement, volatility and interest rate changes, and other market conditions for a charted symbol. They allow you to develop and back-test your trading ideas and, when appropriate, automate buy/sell signals and order generation. When strategies are applied to a chart, onscreen cues are displayed (arrows, flags, numbers and order names) to show you when your strategy rules would have historically placed trades. Once you apply a strategy to a chart, you can modify the general, back-testing, automation and optimization settings. For more information, see About Strategies.
Drawing Tools
Drawing tools are used to visually highlight information on a chart. Some drawing tools, such as trendlines, let you connect multiple price points to help you analyze the direction or amount of price movement. Non-analytical drawing objects, such as boxes or text objects, call attention to an area of a chart, yet have no specific market interpretation. Drawing objects applied to a chart can be moved, formatted, and stay aligned with new price bar data when the symbol's interval is changed. For more information, see About Drawing Objects.
Account Orders & Positions
Account order & position markers on a chart provide a convenient way to monitor the status of your orders and positions for the charted symbol. Order markers show you the target price for an open limit or stop order. Position markers point to the price on a bar where an order is filled and show the type of order along with its size in shares/contracts. For more information, see Account Orders & Positions.
Chart Trading
Chart Trading is a built-in chart tool that allows you to quickly places trades, manage orders, and monitor positions directly on a chart. For more information, see About Chart Trading.
Creating and Customizing a Chart
The following steps will assist you in creating and customizing a chart:
- Click the Chart Analysis
 icon
icon - To change the symbol on the chart, type the symbol name (which appears in the toolbar's command line) and press ENTER. If you do not know the symbol name, click the Symbol Lookup icon to search the symbol by name or description.
- Use the Style menu to select a bar or chart type (Candlestick, OHLC, Kagi, etc.).
- Use the Data > Edit Symbol menu sequence and select the Settings tab to change the symbol Settings for the selected chart type. The range values let you decide how much historical data you want to appear in the chart window. The interval or chart type you select will determine the amount of historical data displayed.
- Use the Timeframe menu to change the bar interval for the specified bar or chart type. Or, type the interval keyword (i.e., 5 min, 10 min, daily, etc.) and press ENTER (the interval appears in the toolbar's command line). By default, intra-day (time) is displayed when a chart is created. For more information on interval, interval/chart types and range, see Timeframes (Data Intervals).
- Once you have specified your chart settings, you can use the Data > Edit Symbol menu sequence and select the Scaling tab to change the symbol Scaling settings for the chart.
![]() To apply the changes you made for future charts, select the Set as Default check box in each customize dialog.
To apply the changes you made for future charts, select the Set as Default check box in each customize dialog.
Related Topics
Adding or Overlaying Symbols on a Chart
Customizing a Symbol in a Chart
Customizing a Chart Analysis Window
Adding Studies to a Chart or Grid Window
Clicking and Dragging in a Chart
Changing the Vertical Axis Settings on a Chart
Removing a Symbol in a Multi-Data Chart
About Chart Trading (trading from a Chart)
See Also
Refreshing TradeStation Windows
EasyLanguage Utilization Monitor
![]()
![]()
![]() Similar functionality is available in the Mobile and Web Trading versions of TradeStation.
Similar functionality is available in the Mobile and Web Trading versions of TradeStation.