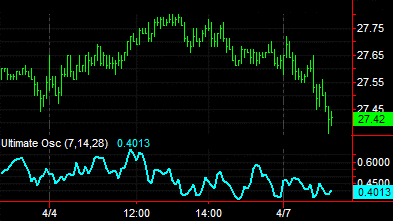
 Ultimate Osc (Indicator)

Input Information
| Name | Expression | Default | Description |
| FastLength | Numeric | 7 | Number of bars to include in calculation of shortest average. |
| MedLength | Numeric | 14 | Number of to include in calculation of intermediate average. |
| SlowLength | Numeric | 28 | Number of bars to include in calculation of longest average. |
Market Synopsis
The Ultimate Oscillator indicator calculates the sums of the True Ranges of the number of bars specified by the inputs FastLength, MidLength and SlowLength. These sums are divided into the sums of the distance from the close to the low. This value is weighted for the three lengths and plotted on the chart.
Many analysts believe divergence between the Ultimate Oscillator as well as a breakout in the trend of the indicator are significant signs. For example, a bullish divergence is said to occur if market prices reach a new low but the indicator does not follow. Conversely, a bearish divergence is said to occur if market prices reach a new high but the indicator does not follow.
Plot Information
| Number | Name | Default Color | Description |
| Plot1 | UltOsc | Cyan | Plots the Ultimate Oscillator value. |
When applied to a chart, this indicator displays one plot in a separate subgraph from the price data.