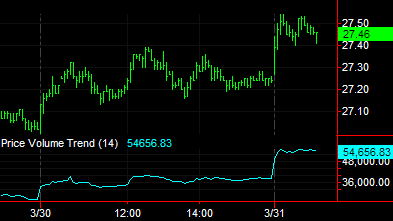
 Price Volume Trend (Indicator)

Input Information
There are no inputs available for this indicator.
Market Synopsis
The Price Volume Trend indicator calculates the percent change in price from the previous bar's close to the close of the current bar. The volume is multiplied by this percentage and added to a running total. The running total is plotted on the chart. The Price Volume Trend indicator is used to help confirm the strength of a trend by identifying divergences between price and volume.
This indicator can indicate possible reversals if an increase in price is not accompanied by a similar increase in volume. Generally speaking, if a divergence exists between a trend's volume and price, momentum may be slowing and a price reversal may occur. Because the Price Volume Trend begins accumulating values from the left of the chart, the numeric value of the Price Volume Trend will depend on the data available in the chart. Therefore, the relative value, or trend direction, of the Price Volume Trend is more important than its numeric value.
Plot Information
| Number | Name | Default Color | Description |
| Plot1 | PVT | Cyan | The price volume trend. |
When applied to a chart, this indicator displays one plot in a separate subgraph from the price data.