 Price Channel (Indicator)

![]() VIDEO - Price Channel Indicator
VIDEO - Price Channel Indicator
Input Information
| Name | Expression | Default | Description |
| Length | Numeric | 20 | Number of bars to include in the calculation. |
| Displace | Numeric | 0 | Number of bars to displace the plot of the Price Channel. |
Market Synopsis
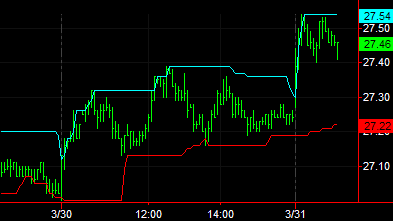
The Price Channel indicator calculates the highest high and lowest low of the trailing number of bars specified by the input Length. Lines representing the trailing highs and the trailing lows are then plotted. When a market moves above the upper band, it is a sign of market strength. Conversely, when a market moves below the lower band, it is a sign of market weakness. A sustained move above or below the channel lines may indicate a significant breakout.
This indicator is not displaced by default. Changing the input Displace to a positive number displaces the plot to the left. Changing the input Displace to a negative number displaces the plot to the right.
Plot Information
| Number | Name | Default Color | Description |
| Plot1 | LowerBand | Cyan | Plots the trailing low as a line. |
| Plot2 | UpperBand | Red | Plots the trailing high as a line. |
| Plot3 | %P | Default | Plots the %P based on the channel width (only in grid apps). |
When applied to a chart, this indicator displays two plots in the same subgraph as the price data. For grids, the indicator displays three plots.