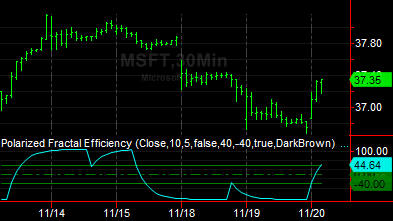
 Polarized Fractal Efficiency (Indicator)
Input Information
| Name | Expression | Default | Description |
| Price | Numeric | Close | Value used in the calculations. |
| Length | Numeric | 10 | The number of bars over which the efficiency is calculated. |
| SmoothingLength | Numeric | 5 | The length for smoothing the efficiency using an exponential moving average calculation; For no smoothing, enter 1 |
| UseAdjustedBaseLength | TrueFalse | False | True when the number of bars over which the price change occurred is the value of the Length input minus one; False when the number of bars over which the price change occurred is the value of the Length input. |
| OverBought | Numeric | 40 | Overbought reference. |
| OverSold | Numeric | -40 | Oversold reference. |
Market Synopsis
The PFE (Polarized Fractal Efficiency) indicator calculates and displays the efficiency of price movement between two price points by comparing the straight-line distance between the two price points to the actual distance that price traveled between the two price points. The calculations are based on the Pythagorean theorem. See referenced article below for more information.
Plot Information
| Number | Name | Default Color | Description |
| Plot1 | PFE | Cyan | Plots the MAMA value. |
| Plot2 | OverBought | DarkGreen | In a chart, plots an over bought reference line. |
| Plot3 | OverSold | DarkGreen | In a chart, plots an over sold reference line. |
| Plot4 | ZeroLine | DarkGreen | In a chart, plots a zero reference line. |
When applied to a chart, this indicator displays one plot in the same subgraph as the price data.