 Mov Avg Hull (Indicator)
Input Information
| Name | Expression | Default | Description |
| Price | Numeric | Close | Value to be used in calculating the Hull Moving Average (HMA). |
| Length | Numeric | 9 | Number of bars to include in the calculation. |
| Displace | Numeric | 0 | Number of bars to displace the plot of the HMA. |
Market Synopsis
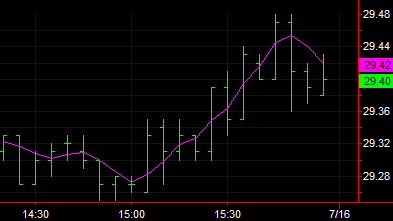
The moving average may be the most widely used indicator. The Mov Avg Hull indicator calculates and plots a weighted average of prices based on a formula by Alan Hull that creates a fast moving average that gives quick signals for trend changes while maintaining curve smoothness.
HMA = WAverage( 2 * WAverage( Price, IntPortion( Length * 0.5 ) ) - WAverage( Price, Length ), IntPortion( SquareRoot( Length ) ) )
A moving average is generally used for trend identification. Attention is given to the direction in which the average is moving and to the relative position of prices and the moving average. Rising moving average values (direction) and prices above the moving average (position) would indicate an uptrend. Declining moving average values and prices below the moving average would indicate a downtrend. A displaced moving average plots the moving average value of a previous bar or later bar on the current bar. This indicator is NOT displaced by default. Changing the input Displace to positive number displaces the plot to the left. Changing the input Displace to a negative number displaces the plot to the right.
Plot Information
| Number | Name | Default Color | Description |
| Plot1 | HMA | Magenta | Plots the HMA value. |
When applied to a chart, this indicator displays one plot in the same subgraph as the price data.