 Ichimoku Cloud (Indicator)

Input Information
| Name | Expression | Default | Description |
| Tenkan_Sen_Length | Numeric | 9 | Number of bars to be used in the calculation of the Tenkan line. |
| Kinjun_Sen_Length | Numeric | 26 | Number of bars to be used in the calculation of the Kinjun line. |
| Senkou_Span_B_Length | Numeric | 52 | Number of bars to be used in the calculation of the Senkou Span B value. |
| Senkou_Span_Offset | Numeric | 26 | Number of bars to the right of the last price bar to plot the current Senkou Span A and Senkou Span B values. |
| Show_Chikou_Span | TrueFalse | True | True to plot the Chikou span line or False to not plot this line in a chart. |
| Chikou_Offset | Numeric | 26 | Number of bars back to offset the plot of the Chikou line (if shown). |
| Up_Cloud_Color | Numeric | RGB (68, 141, 223) | Color to use to fill the cloud when Senkou Span A is above Senkou Span B. Also applies to PriceLoc cell background in a grid. |
| Down_Cloud_Color | Numeric | RGB (221, 111, 0) | Color to use to fill the cloud when Senkou Span A is below Senkou Span B. Also applies to PriceLoc cell background in a grid. |
| Background_Up_Color | Numeric | DarkBlue | Color of cell backgrounds when plotting the string "UP" in grid applications. |
| Background_NewUp_Color | Numeric | Blue | Color of cell backgrounds when plotting the string "NEWUP" in grid applications. |
| Background_Down_Color | Numeric | DarkRed | Color of cell backgrounds when plotting the string "DOWN" in grid applications. |
| Background_NewDown_Color | Numeric | Red | Color of cell backgrounds when plotting the string "NEWDOWN" in grid applications. |
| Background_Neutral_Color | Numeric | DarkGray | Color of cell backgrounds when plotting the string "Neutral" in grid applications. |
Market Synopsis
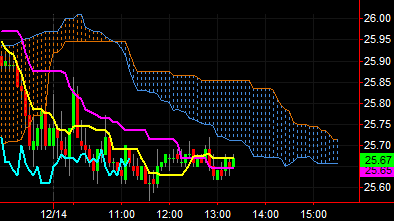
Ichimoku is a price channel-based technical indicator that generates a series of lines to determine trend direction along with support and resistance levels. Originally designed for weekly charts, it can also be effective on other time frames. Developed in Japan, Ichimoku translated means; "one glance balanced chart" or "one look". It is available for Chart Analysis and RadarScreen (RS).
The Tenkan and Kijun lines are the trend confirmation component of the Ichimoku indicator.
Tenkan (Yellow): Highest High and Lowest Low of 9 bars, divided by 2.
Kijun (Magenta): Highest High and Lowest Low of 26 bars, divided by 2.
Typically a trader will look for crossovers of these two lines to initiate a position or confirm the trend. Tenkan above Kijun = Bullish. Tenkan below Kijun = Bearish.
Alternative Daily Chart Inputs: Tenkan(5 or 8), Kijun(21 or 22)
The Ichimoku Cloud represents historical price ranges for support and resistance levels. The difference between the two lines is called the 'Cloud'. This is the support and resistance component of the Ichimoku. A thicker cloud mitigates or compensates high volatility (e.g. it is harder for price action to penetrate the entire cloud in high volatility situations).
SenkouSpan_A (Top Cloud Line): Tenkan + Kijun divided by 2. The calculation is then plotted displaced 22 to 26 bars ahead of the current price action.
SenkouSpan_B (Bottom Cloud Line): HighestHigh and LowestLow of 52 bars divided by 2. The calculation is then plotted displaced 26 bars ahead of the current price action.
Typically a trader will look for a re-entry in the direction of the trend as prices bounce off the cloud. If prices break through the cloud, it is a good indication of a change in trend direction.
Daily Chart Inputs: SenkouSpanA (try 21 or 22), SenkouSpanB (try 42 or 44)
The Chikou line is a secondary trend confirmation.
Chikou (Cyan): a 26 bar historically displaced line of the current close.
The Chikou line above or below the cloud confirms the new trend direction. This is a simple momentum indicator.
Daily Chart Inputs: Chikou (try 20 or 22).
Plot Information
| Number | Name | Default Color | Description |
| Plot1 | Tenkan | Yellow | Plots the Tenkan Sen value. |
| Plot2 | Kijun | Magenta | Plots the Kijun Sen value. |
| Plot3 | Chikou | Cyan | Plots the Chikou Offset value. |
| Plot4 | SenkouSpan_A | Up Cloud | Plots the Senkou Span A value. |
| Plot5 | SenkouSpan_B | Down Cloud | Plots the Senkou Span B value. |
| Plot6 | A_Cloud | Up/Down | Plots fill color to "shade" the A cloud. |
| Plot7 | B_Cloud | Up/Down | Plots fill color to "shade" the B cloud. |
| Plot8 | Trend Dir | Up/Down/Neutral | Plots the trend direction text message (RS only). |
| Plot9 | Price Loc | Up/Down/Neutral | Plots the price location text message (RS only). |
| Plot10 | Chikou Dir | Up/Down/Neutral | Plots the Chikou direction text message (RS only). |
When applied to a chart, this indicator displays plots and clouds in the same subgraph as the price data.