 Triangle Pattern (ShowMe)
Input Information
|
Name |
Expression |
Default |
Description |
|
PivotHighPrice |
Numeric |
High |
EasyLanguage expression to use for pivot high determination |
|
PivotLowPrice |
Numeric |
Low |
EasyLanguage expression to use for pivot low determination |
|
PivotHighLeftStrength |
Numeric |
3 |
The number of bars to the right of the current bar to be analyzed to see if the price of those bars is less than the price of the current bar |
|
PivotHighRightStrength |
Numeric |
3 |
The number of bars to the right of the current bar to be analyzed to see if the price of those bars is less than the price of the current bar |
|
PivotLowLeftStrength |
Numeric |
3 |
The number of bars to the left of the current bar to be analyzed to see if the price of those bars is greater than the price of the current bar |
|
PivotLowRightStrength |
Numeric |
3 |
The number of bars to the right of the current bar to be analyzed to see if the price of those bars is greater than the price of the current bar |
|
TrendlineThickness |
Numeric |
1 |
Thickness for the pattern trendlines (valid values are between 0 and 6) |
|
TrendlineColor |
Numeric |
Yellow |
Color used for the trendlines |
|
DotMarkerColor |
Numeric |
Magenta |
Color used for the ShowMe (dot) marker |
|
TrendlineColorTransparency |
Numeric |
0 |
Percentage transparency of the pattern trendlines (valid values are between 0 and 100) |
|
DrawProfitZoneRectangle |
Numeric |
1 |
Enter 1 to draw the profit zone rectangle. Enter 0 to not draw the rectangle. |
|
NumMeasMovesToPT |
Numeric |
1 |
Number of measured moves used to determine the target price for the pattern |
|
ProfitZoneFillColorTransparency |
Numeric |
75 |
Percentage transparency of the profit zone rectangle fill color (valid values are between 0 and 100) |
|
ProfitZoneOutlineColor |
Numeric |
Yellow |
Outline color used for the profit zone rectangle |
|
ProfitZoneFillColor |
Numeric |
Yellow |
Fill color used for the profit zone rectangle |
|
NumATRsforProfitZoneHeight |
Numeric |
1 |
Number of ATRs to be used to determine the 'height' of the profit zone rectangle |
|
MaxDurationBarsForProfitZone |
Numeric |
60 |
Maximum number of bars that the profit zone rectangle will be drawn |
|
ATRLength |
Numeric |
14 |
Number of bars to use in the moving average of true range |
|
MaxDurationBars |
Numeric |
60 |
Maximum number of bars that trendlines (after pattern is confirmed) will be drawn |
|
BreakoutDotPlotOffsetTicks |
Numeric |
1 |
Number of price ticks to offset the plot from the trendline value |
Description
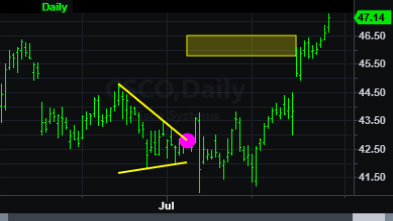
This study identifies "triangle" patterns on a chart, which is a pattern consisting of lower pivot highs and higher pivot lows.
Once a triangle pattern is found, two trendlines are drawn; the trendline thickness and color are controlled by the 'TrendlineThickness' and 'TrendlineColor' input values.
Both trendlines will be extended to the right until 1) the maximum number of bars allowed in the pattern ('MaxDurationBars' input value) is reached, or 2) one of the trendlines is penetrated on a closing price basis, or 3) the trendlines cross each other
If the Close (bar closing tick only) penetrates a trendline, the bar will be marked with a ShowMe dot, an alert is triggered, a profit zone rectangle will be drawn, and both trendlines will be truncated on the bar of penetration.
A target price for the pattern will be shown using a rectangle. The closest side of the rectangle from the pattern will be at a distance that is equal to the distance between the first two pivot prices multiplied by the 'NumMeasMovesToPT' input value, measured from the point at which the breakout penetrated the trendline. The "height" of the rectangle is calculated as the Average True Range times the value in the NumATRsforProfitZoneHeight' input. This rectangle is referred to as the "profit zone rectangle".
The profit zone rectangle will be drawn until 1) the maximum number of bars allowed in the pattern ('MaxDurationBarsForProfitZone' input value) is reached, or 2) a bar penetrates the target price. For a breakout above the pattern, the rectangle will be truncated if the High of a bar exceeds or is equal to the closest side of the rectangle. For a breakout below the pattern, the rectangle will be truncated if the Low of a bar is less than or equal to the closest side of the rectangle.
Penetration of the target price is checked intrabar.
Plot Information
| Plot Number | Plot Name | Default Color | Description |
| Plot1 | Tri-Breakout | Controlled by inputs | Plots a dot marker upon breakout of trendline. Plot price is the trendline price on the breakout bar +/- the number of ticks in the “BreakoutDotPlotOffsetTicks” input. |
Related Classes
Uses classes from the following namespaces:
elsystem.drawing;
elsystem.drawingobjects;
elsystem.collections;
elsystem.windows.forms;