 Megaphone Pattern (ShowMe)
Input Information
| Name | Expression | Default | Description |
| PivotHighPrice | Numeric | High | EasyLanguage expression to use for pivot high determination. |
| PivotLowPrice | Numeric | Low | EasyLanguage expression to use for pivot low determination. |
| PivotHighLeftStrength | Numeric | 3 | The number of bars to the left of the current bar to be analyzed to see if the price of those bars is less than the price of the current bar. |
| PivotHighRightStrength | Numeric | 3 | The number of bars to the right of the current bar to be analyzed to see if the price of those bars is less than the price of the current bar. |
| PivotLowLeftStrength | Numeric | 3 | The number of bars to the left of the current to be analyzed to see if the price of those bars is greater than the price of the current bar. |
| PivotLowRightStrength | Numeric | 3 | The number of bars to the right of the current to be analyzed to see if the price of those bars is greater than the price of the current bar. |
| PivotDeltaATRMin | Numeric | 0.1 | The minimum number of ATRs (used as a price difference) required between successive pivot high prices or successive pivot low prices to validate the pattern. |
| PivotDeltaATRMax | Numeric | 5.0 | The maximum number of ATRs (used as a price difference) allowed between successive pivot high prices or successive pivot low prices to validate the pattern. |
| TrendlineThickness | Numeric | 1 | The thickness for the pattern trendlines. Valid values are between 0 and 6. |
| TrendlineColor1 | Numeric | Yellow | The color to be used for the trendlines. Color will alternate between this color and TrendlineColor2 |
| TrendlineColor2 | Numeric | Red | The color to be used for the trendlines. Color will alternate between TrendlineColor1 and this color. |
| DotMarkerColor1 | Numeric | Magenta | The color to be used for the ShowMe marker. Color will alternate between this color and DotMarkerColor2. |
| DotMarkerColor2 | Numeric | Cyan | The color to be used for the ShowMe marker. Color will alternate between DotMarkerColor1 and this color. |
| TrendlineColorTransparency | Numeric | 0 | The percentage transparency of the pattern trendlines. Valid values are between 0 and 100. |
| DrawProfitZoneRectangle | Numeric | 1 | Enter 1 to draw the profit zone rectangle. Enter 0 to not draw the rectangle. |
| ProfitZoneFillColorTransparency | Numeric | 75 | The percentage transparency of the profit zone rectangle fill color. Valid values are between 0 and 100. |
| NumATRsforProfitZoneHeight | Numeric | 1 | The number of ATRs to be used to determine the 'height' of the profit zone rectangle. |
| ATRLength | Numeric | 14 | The number of bars to use in the moving average of true range |
| MaxDurationBars | Numeric | 60 | The maximum number of bars that trendlines (after pattern is confirmed) or profit zone rectangles will be drawn. |
| PlotOffsetTicks | Numeric | 1 | The number of price ticks to offset the plot from the bar high or low. |
Market Synopsis
This study identifies "megaphone" patterns on a chart, which is a pattern consisting of higher pivot highs and lower pivot lows. For more information on the requirements for validation of the pattern, see the code commentary.
Once a pattern is confirmed, two trendlines are drawn with the same color. The color of the trendlines will alternate between the colors specified in the 'TrendlineColor1' and 'TrendlineColor2' inputs. The thickness of the trendlines in controlled by the 'TrendlineThickness' input value.
Both trendlines will be extended to the right until 1) the maximum number of bars allowed in the pattern ('MaxDurationBars' input value) is reached, or 2) one of the trendlines is penetrated on a closing price basis.
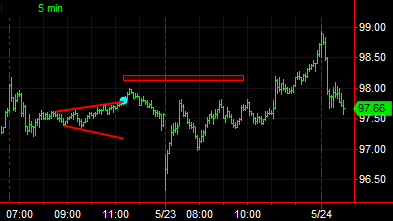
If the Close (on bar closing tick only) penetrates a trendline, the bar will be marked with a ShowMe dot, both trendlines will be truncated, and a target price for the pattern will be shown using a rectangle. The target price of the pattern is the furthest side of the rectangle. PivotHighPrice
The profit zone rectangle will be drawn until 1) the maximum number of bars allowed in the pattern ('MaxDurationBars' input value) is reached, or 2) a bar penetrates the target price (farthest side of the rectangle). For a breakout above the pattern, the rectangle will be truncated if the High of a bar exceeds the farthest side of the rectangle. For a breakout below the pattern, the rectangle will be truncated if the Low of a bar is less than the farthest side of the rectangle.
Plot Information
The study plots a marker on the bar that penetrates one of the pattern trendlines.
When applied to a chart, this indicator plots in the same subgraph as the price data.