 C_Hammer_HangingMan (ShowMe)
 Disclaimer
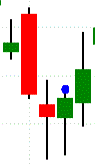
|
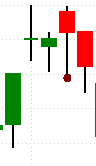
|
| Hammer | Hanging Man |
C_Hammer_HangingMan displays a ShowMe for two Japanese candlestick patterns; Hammer and Hanging Man.
Hammer is defined as:
-
The body of the candle is in the upper half of the bar, and the tail is usually twice as long as the body
-
The price trend is declining
-
It can be a red or green candle, but not a Doji
Hanging Man is defined as:
-
The body of the candle is in the upper half of the bar, and the tail is usually twice as long as the body
-
The price trend is advancing
-
It can be a red or green candle, but not a Doji
Input Information
| Name | Default | Description |
| Length | 14 | Length used to calculate the average body |
| Factor | 2 | Threshold factor for the size of body in relation to the range of the bar ( 2 = Tail must be 2x larger than body) |
Description
Hammer may be considered a bullish reversal bottom pattern, that needs confirmation.
Hanging Man may be considered a bearish reversal top pattern that needs confirmation.
Plots
Hammer plots on the High when true for the current bar.
Hanging Man plots on the Low when true for the current bar.