 ZigZag % (Indicator)
Input Information
| Name | Expression | Default | Description |
| HighPivotPrice | Numeric | High | Price value used to identify the pivot high. |
| LowPivotPrice | Numeric | Low | Price value used to identify the pivot low. |
| RetracePct | Numeric | 5 | Minimum percentage difference between swing points to plot. |
| LineColor | Numeric | Yellow | Color to use for the trendlines. |
| LineWidth | Numeric | 1 | Thickness to use for the trendlines. |
Market Synopsis
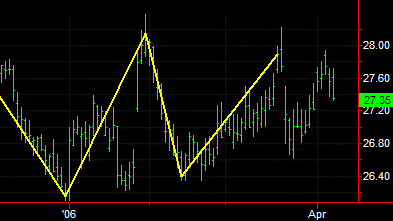
The ZigZag % indicator finds swing points that are distant by at least the percent specified by the input RetracePct. A high swing point is when the price is higher than the prices before and after it; a low swing point is when the price is lower than the prices before and after it. The color and weight of the lines drawn with this indicator may be adjusted by editing the inputs LineColor and LineWidth.
Plot Information
This indicator does not plot any values. When applied to a chart, this indicator displays lines connecting high and low swing points.