 Volume Ratio (Indicator)
Input Information
| Name | Expression | Default | Description |
| AvgLength | Numeric | 14 | Factor used in calculating the Volume Oscillator. |
| UpVolAlertPct | Numeric | 5 | Value at which the alert for "Up" ticks is triggered. |
| DnVolAlertPct | Numeric | -5 | Value at which the alert for "Down" ticks is triggered. |
| ColorNormLength | Numeric | 14 | Number of bars over which to normalize the indicator for gradient coloring. |
| UpColor | Numeric | Yellow | Color to use for indicator values that are relatively high over ColorNormLength bars. Set to -1 to disable gradient color plotting. |
| DnColor | Numeric | Cyan | Color to use for indicator values that are relatively low over ColorNormLength bars. Set to -1 to disable gradient color plotting. |
Market Synopsis
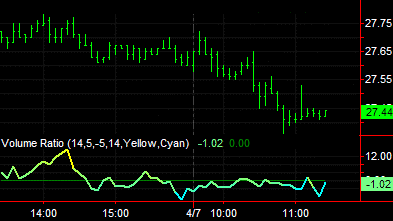
The Volume Ratio indicator calculates an exponential moving average of the ratio between up and down volume. The exponential average is then plotted as an oscillator around a zero line.
Volume can provide insight into the strength or weakness of a price trend. This indicator plots positive values above the zero line, and negative below. A positive value suggests there is enough market support to continue to drive price activity in the direction of the current trend. A negative value suggests there is a lack of support and prices may begin to become stagnant or reverse.
Plot Information
| Number | Name | Default Color | Description |
| Plot1 | VolRatioAvg | Yellow/Cyan | Plots the Volume Ratio value. |
| Plot2 | ZeroLine | Dark Green | Plots a reference line at zero. |
When applied to a chart, this indicator contains two plots, displayed in a separate subgraph from the price data.
Set either UpColor and/or DnColor to -1 to disable gradient plot coloring. When disabled, Plot1 color is determined by settings in indicator properties dialog box. Plot2 (ZeroLine) color always comes from indicator properties dialog box.
![]() This indicator only returns significant results when applied to bars with a time interval of tick or intraday.
This indicator only returns significant results when applied to bars with a time interval of tick or intraday.