 Volume Custom (Indicator)
Input Information
| Name | Expression | Default | Description |
| Ticks_or_TradeVol_0_or_1 | Numeric | 1 | Specifies whether to plot tick count or trade volume (contracts/shares). |
| Up_Down_or_Total_0_or_1_or_2 | Numeric | 2 | Specifics whether to include up and/or down tick count or trade volume in plot . |
Market Synopsis
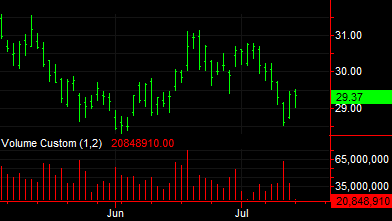
The Volume Custom indicator is designed to plot various volume-related data fields on charts containing daily, weekly, or monthly bars. This indicator is not intended for application to charts set to intraday or tick bar intervals, or to other types of charts (kagi, renko, etc.).
Plot Information
| Number | Name | Default Color | Description |
| Plot1 | Volume | Red | Plots the volume as a histogram. |
When applied to a chart, this indicator displays a histogram in a different subgraph than the price data. When applied to a grid the indicator displays the up/down/total ticks and up/down/total trade volume in separate columns.