 Volatility Std Dev (Indicator)
Input Information
| Name | Expression | Default | Description |
| Length | Numeric | 30 | Number of bars of data to be included in calculation. |
Market Synopsis
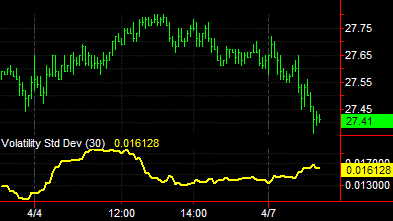
The Volatility Std Dev indicator calculates and plots the volatility of a market using prices from the number of bars specified by the input Length. The value returned is 1 annual standard deviation in price expressed as a percent of the market price. Options traders will recognize the Volatility StdDev indicator is akin to statistical volatility.
While you can apply this indicator to any time frame, it is designed for use with daily bars because the values are annualized based on a daily timeframe. Using another time frame causes the values not to be accurate because the annualization is not calculated properly.
Plot Information
| Number | Name | Default Color | Description |
| Plot 1 | VoltSDev | Yellow | Plots the Volatility Std Dev value. |
When applied to a chart, this indicator displays one plot in a separate subgraph from the price data. When applied to a grid, this indicator displays one value in a column of cells.