 Typical Price (Indicator)
Input Information
| Name | Expression | Default | Description |
| Length | Numeric | 9 | Number of bars to include in calculation of the average of Typical Price. |
Market Synopsis
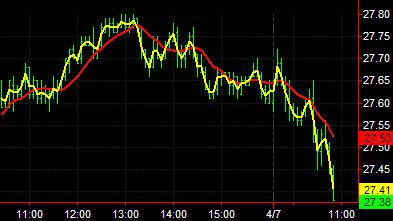
The Typical Price for each bar is calculated as an average of 3 values: high, low and close. This value is then plotted on the chart. An average of the Typical Price from the most recent number of bars specified by the input Length is also plotted. Using the Typical Price instead of the close in calculating and plotting, say, a moving average weighs the high and low into the calculation.
This indicator can be used in a manner similar to the Mov Avg 2 Lines, with attention given to the direction and relative position of prices, Typical Price and the average of the Typical Price. (Typical Price is known to some traders as the pivot point.)
Plot Information
| Number | Name | Default Color | Description |
| Plot1 | TypPrice | Yellow | Plots the Typical Price value. |
| Plot2 | Avg | Red | Plots the average of the Typical Price value. |
When applied to a chart, this indicator displays two plots in a separate subgraph from the price data.