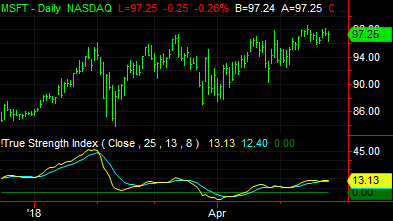
 True Strength Index (Indicator)

Input Information
|
Name |
Expression |
Default |
Description |
|
Price |
Close |
EasyLanguage expression to use in calculation of the True Strength Index. |
|
|
SmoothingLength1 |
Numeric |
25 |
Number of bars used in the calculation of the first smoothing factor used in the calculation of the True Strength Index. |
|
SmoothingLength2 |
Numeric |
13 |
Number of bars used in the calculation of the second smoothing factor used in the calculation of the True Strength Index. |
|
TSISmoothingLength |
Numeric |
8 |
Number of bars used in the calculation of the smoothing factor used to average the True Strength Index. |
Market Synopsis
The True Strength Index indicator is a momentum-based indicator that is calculated by a double smoothing of a price change amount. The indicator is normalized to be between -100 and 100. See the TSI function for the calculations.
The indicator uses a price difference (momentum) along with a smoothing of the price difference so it can combine the leading characteristic of momentum and the smoothing/lagging characteristics of an average to indicate price trend, but also aid in identifying market turns. The signal line (smoothing of the TSI) is used to aid in identifying potential trend changes when the TSI value crosses over or under the Signal line. Alerts for these crosses are included in the indicator.
Plot Information
|
Number |
Name |
Default Color |
Description |
|
Plot1 |
TSI |
Yellow |
Plots the True Strength Index value. |
|
Plot2 |
Signal |
Cyan |
TSI Signal line which is a smoothed TSI value. |
|
Plot3 |
ZeroLine |
Light Green |
Plot of zero. |
When applied to a chart, this indicator displays three plots in a separate subgraph from the price data.