 TrendLines Automatic (Indicator)
Input Information
| Name | Expression | Default | Description |
| SwHighStrength | Numeric | 4 | Number of bars used to calculate the relative swing high strength. |
| SwLowStrength | Numeric | 4 | Number of bars used to calculate the relative swing low strength. |
| BarsPast | Numeric | 10 | Truncates the trendline on the right after the specified number of bars when the next new trendline is drawn (History must be set to "No".) |
| History | String | "Yes" | "Yes" applies multiple trendlines illustrating up and down markets. Truncates the trendline when the next trendline is drawn. |
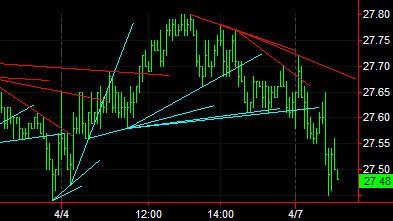
| DnTLColor | String | "Red" | Specified the color of the down trendline. |
| UpTLColor | String | "Cyan" | Specifies the color of the up trendlline. |
| AlertType | String | "IntraBar" | Specifies the type of alert: "Intrabar" allows alerts as a bar builds, "OnClose" alerts when the bar closes, and "None" turns off alerts for all trendlines created by the indicator. |
Market Synopsis
Trendlines are the foundation for identifying and confirming many of the characteristics comprising price trends and patterns. The most common use of trendlines is to determine the slope of a trend, which is then used to monitor up and down trending markets. These types of trendlines help to determine the strength of the trend by measuring its slope.
Sideways trendlines are used to indicate support and resistance levels. Additionally, trendlines help identify when a trend reversal or breakout occurs.
The TrendLines Automatic indicator plots trendlines at significant high and low points on a chart, helping to determine market direction, breakouts, and market reversals.
Plot Information
This indicator does not contain plot statements; rather it draws trendlines, which are displayed in the same subgraph as the price data. The default colors are cyan for up trendlines and red for down trendlines.