 Strategy Equity (Indicator)
Input Information
| Name | Expression | Default | Description |
|
PositiveClosedEquityColor
|
Numeric |
UpColorDefault
|
Color used when the closed equity is greater than zero. |
| PositiveOpenEquityColor | Numeric | UpColorDefault | Color used when the open equity is greater than zero. |
| NegativeClosedEquityColor | Numeric | DownColorDefault | Color used when the closed equity is less than or equal to zero. |
| NegativeOpenEquityColor | Numeric | DownColorDefault | Color used when the open equity is less than or equal to zero. |
Market Synopsis
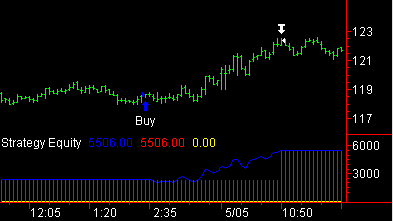
The Strategy Equity indicator plots the results of a trading strategy applied to a chart. The plots represent the cumulative profit or loss on closed trades and the cumulative profit or loss on closed trades plus the open position profit or loss.
This indicator provides a bar-by-bar picture of the results of a strategy applied to the price data. This is often known as the equity curve of a trading strategy and is a visual representation of the strategy's consistency. It shows during what periods profits and losses occurred. This indicator only returns results when applied to a chart containing a strategy.
Plot Information
| Number | Name | Default Color | Description |
| Plot1 | OpenEquity | Controlled by inputs depending on whether the value is greater than or less than zerom | Plots the cumulative realized closed profit/loss plus the profit/loss on open positions as a line. |
| Plot2 | ClosedEquity | Controlled by inputs depending on whether the value is greater than or less than zerom | Plots the cumulative realized (closed trades) profit/loss as a histogram. |
| Plot3 | ZeroLine | Controlled by inputs. | Plots a horizontal line at 0. |
When applied to a chart, this indicator displays three plots in a separate subgraph from the price data.