 Stochastic Double Slow (Indicator)
Input Information
| Name | Expression | Default | Description |
| PriceH | Numeric | High | Price used as the upper end of range to calculate DblSlwK. |
| PriceL | Numeric | Low | Price used as the lower end of range to calculate DblSlwK. |
| PriceC | Numeric | Close | Value used as current price to calculate DblSlwK. |
| StochLength | Numeric | 14 | Number of bars used to calculate DblSlwK. |
| SmoothingLength1 | Numeric | 3 | Number of bars used to slow FastK to FastD. |
| SmoothingLength2 | Numeric | 3 | Number of bars used to slow FastD to SlowD. |
| SmoothingType | Numeric | 1 | 1 = original, 2 = legacy |
| OverSold | Numeric | 20 | DblSlwK level considered oversold. |
| OverBought | Numeric | 80 | DblSlwK level considered overbought. |
Market Synopsis
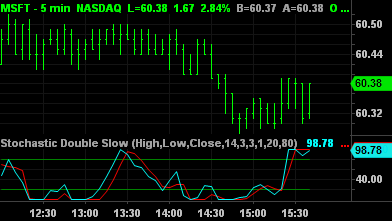
The Stochastic Double Slow indicator calculates the location of a current price in relation to its range over a period of bars. The default settings are to use the most recent 14 bars (input StochLength), the high and low of that period to establish a range (input PriceH and PriceL) and the close as the current price (input PriceC).
This calculation is then indexed, smoothed and plotted as DblSlwK. A smoothed average of DbleSlwK, known as DblSlwD, is also plotted. DbleSlwK and DblSlwD plot as oscillators with values from 0 to 100. The direction of the Stochastics should confirm price movement. For example, rising Stochastics confirm rising prices.
Stochastics can also help identify turning points when there are non-confirmations or divergences. For example, a new high in price without a new high in Stochastics may indicate a false breakout. Stochastics are also used to identify overbought and oversold conditions when the Stochastics reach extreme highs or lows. Additionally, DbleSlwK crossing above the smoother DblSlwD can be a buy signal and vice versa.
Plot Information
| Number | Name | Default Color | Description |
| Plot1 | DblSlwK | Cyan | Plots the DoubleSlowK as a line. |
| Plot2 | DblSlwD | Red | Plots the DoubleSlowD as a line. |
| Plot3 | OverBot | Dark Green | Plots the overbought level reference line. |
| Plot4 | OverSld | Dark Green | Plots the oversold level reference line. |
When applied to a chart, this indicator displays four plots in a separate subgraph from the price data.