 Spread - Ratio (Indicator)
Input Information
| Name | Expression | Default | Description |
| DataSeries1 | Numeric | Close of Data1 | Value to be divided by DataSeries2. |
| DataSeries2 | Numeric | Close of Data2 | Value to divide into DataSeries1. |
| HiAlert | Numeric | 1 | Value of the high alert. |
| LoAlert | Numeric | 0 | Value of the low alert. |
Market Synopsis
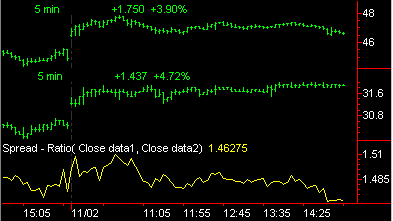
The Spread - Ratio indicator calculates the ratio of prices of 2 markets. This is primarily used to track futures spreads. Futures spread traders follow price relationships between related futures. The Spread - Ratio indicator might be used to track the gold / silver ratio, or the ratio of soybean prices to corn prices. Plotting this indicator requires at least two symbols in the chart.
Plot Information
| Number | Name | Default Color | Description |
| Plot1 | SprdRatio | Yellow | Plots the Spread as a line |
When applied to a chart, this indicator displays one plot in a separate subgraph from the price data.