 Spread - Diff (Indicator)
Input Information
| Name | Expression | Default | Description |
| DataSeries1 | Numeric | Close of Data1 | Value from which to subtract DataSeries2 |
| DataSeries2 | Numeric | Close of Data2 | Value to subtract from DataSeries1 |
| HiAlert | Numeric | 10000000 | Value of the high alert. |
| LoAlert | Numeric | -10000000 | Value of the low alert. |
Market Synopsis
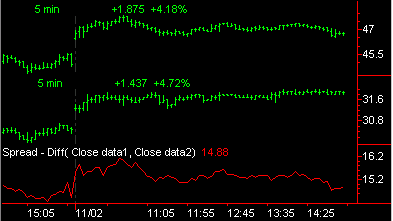
The Spread - Diff indicator calculates the arithmetic difference between prices of 2 markets. This is primarily used to track futures spreads. Futures spread traders follow price relationships between related futures, such as S & P 500 and Dow Jones futures, as well as price relationships between different contracts in the same market, such as June T-bonds and December T-bonds. Plotting this indicator requires at least two symbols in the chart.
Plot Information
| Number | Name | Default Color | Description |
| Plot1 | SprdDiff | Red | Plots the Spread as a line |
When applied to a chart, this indicator displays one plot in a separate subgraph from the price data.