 RSI JP (Indicator)
Input Information
| Name | Expression | Default | Description |
| Price | Numeric | Close | Value used in calculating the RSI JP. |
| Length | Numeric | 9 | Bars over which to calculate the RSI JP value. |
| OverSold | Numeric | 30 | Level at which you consider the market to be oversold (too low). |
| OverBought | Numeric | 70 | Level at which you consider the market to be overbought (too high). |
| ColorCellBGOnAlert | TrueFalse | True | True to change the background color of a grid cell when an alert occurs (see following input); otherwise False to not color cell. |
| BackgroundColorAlertCell | Numeric | DarkGray | The background color value for a grid cell when an alert occurs (see previous input) |
Market Synopsis
The RSI JP indicator calculates and displays an alternate RSI value based on the ratio of the average price increase (price of current bar greater than the price of the prevpis bar) to the absolute average price change. It is available for Chart Analysis and RadarScreen.
Plot Information
| Number | Name | Default Color | Description |
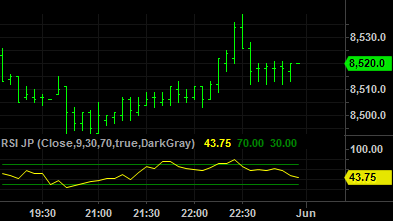
| Plot1 | RSI JP | Yellow | Plots the RSI JP value. |
| Plot2 | OverBot | Green | Plots a reference line at the OverBought level. |
| Plot3 | OverSold | Green | Plots a reference line at the OverSold level. |
| Plot4 | OB/OS Zone | Cyan | Displays a message (grid only) when an alert occurs when the value exceeds a over sold or over bought alert values. |
When applied to a chart, this indicator displays one plot and two reference lines in a separate subgraph from the price data.