 Rondeau’s Reversion (Indicator)
Input Information
| Name | Expression | Default | Description |
| Plots R-Reversion Channel | Numeric |
1 |
A value of 1 displays the R-Reversion Channel. |
| Display R-Reversion Channel Midline | Numeric | 0 | A value of 1 displays the R-Reversion Channel midline. |
| Display Intensity Adjusted Prices | Numeric | 0 | A value of 1 displays R-Reversion adjusted prices if equipt. |
| Display Channel Data on Chart | Numeric | 1 | A value of 1 displays the R-Reversion Ratio reading on the chart. |
| Adjust Font Size | Numeric | 10 | Value adjusts the font size for the R-Reversion Ratio on the chart. The range is (8 - 48). |
| Adjust Horizontal Text Location | Numeric | 90 | Value adjusts the horizontal location of the R-Reversion Ratio on the chart. The range is (5 - 95). |
| Adjust Vertical Text Location | Numeric | 92 | Value adjusts the vertical location of the R-Reversion Ratio on the chart. The range is (5 - 95). |
| Enables Channel Alerts | Numeric | 0 | A value of 1 activates the R-Reversion channel study alerts. |
| Study on = 1 | off = 0 | Numeric | 1 | Internal study method to turn the R-Reversion study on or off. |
| Conventional_1 Custom_2 | Numeric | 1 | R-Reversion mode selector. A value of 1 uses Conventional mode settings at 2 standard deviations. A value of 2 uses the Custom mode user-defined values and settings. |
| Dollars = 1 or Volume = 2 | Numeric | 1 | R-Reversion intensity readings. A value of 1 uses Reversion Dollars and is generally preferred over standard volume measurements. |
| Upper Inner Channel Percentage Level | Numeric | 90 | Value plots the second overbought boundary level for the upper inner R-Reversion Channel. The range is (80 - 100). |
| Lower Inner Channel Percentage Level | Numeric | 10 | Value plots the second oversold boundary level for the lower inner R-Reversion Channel. The range is (0 - 20). |
| Custom Periods for R-Rev Calculations | Numeric | 45 | Custom mode number of periods (bars) to calculate R-Reversion. The range is (20 - 100). |
| Custom Upper Boundary Deviations | Numeric | 2 | Custom mode number of deviations for the upper R-Reversion boundary. The range is (1 - 3). |
| Custom Lower Boundary Deviations | Numeric | 2 | Custom mode number of deviations for the lower R-Reversion boundary. The range is (1 - 3). |
| Standard Deviation Method | Numeric | 1 | Custom mode standard deviation calculation method. Value of 1 for population (preferred) or value of 2 for sample. |
| Custom High-Intensity Threshold | Numeric | 200 | Custom mode buffering threshold for high-intensity moves. The range is (50 – 400). |
| Custom Above Average Intensity Sensitivity | Numeric | 50 | Custom mode above average sensitivity intensity setting widens (higher values) or narrows (lower values) the boundaries. |
| Simple MA = 1 or Exponential MA = 2 | Numeric | 1 | R-Reversion moving average calculation method. Simple is generally preferred over exponential calculations. |
| Intensity Periods | Numeric | 20 | R-Reversion number of intensity periods. This value should be ½ the R-Reversion bar length but not less than 20. The range is (20 – 126 ). |
Market Synopsis
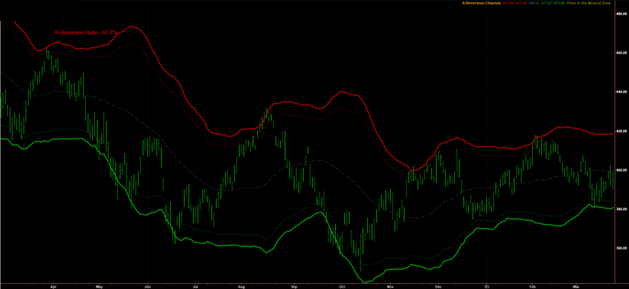
The Rondeau’s Reversion (R-Reversion) indicator measures and integrates price movements (volatility) along with the intensity of those movements. It displays these dynamics through two primary boundary lines: an upper "overbought/distribution" line and a lower "oversold/accumulation" line, both plotted directly over price on a chart.
Unlike traditional indicators, Rondeau’s Reversion independently calculates upward and downward price movements, creating asymmetrical, dynamically adjusting boundaries. These boundaries form the R-Reversion Channel, which reflects the appropriately designated intensity-adjusted volatility.
When price movements display greater relative intensity in either direction, the corresponding R-Reversion boundary extends further outward, widening the R-Reversion channel.
For example, if an issue undergoes multiple down bars with high relative intensity, R-Reversion would push the lower boundary (only) further outward compared to bars with identical downward movements on lower relative intensity. This expansion would reflect a more conservative approach, extending the oversold signal due to the heightened intensity of the bearish participants driving the price action.
Conversely, if an issue undergoes multiple up bars with high relative intensity, R-Reversion would push the upper boundary further outward. This expansion would reflect a more aggressive approach, extending the overbought signal due to the heightened intensity of the bullish participants driving the price action.
The R-Reversion Ratio quantitates the price's current position within the R-Reversion Channel. An R-Reversion Ratio value of 100 means that the price is at the upper boundary “distribution zone,” and a value of zero means that the price is at the lower boundary “accumulation zone”.
Rondeau’s Revision General Interpretation
Rondeau’s Reversion interpretations are similar to other established oscillating or envelope indicators, aiding trend continuation and reversal analysis.
• Prices near the lower R-Reversion boundary occurring with an upward trending issue are considered to be in a potential accumulation zone.
• Prices near the upper R-Reversion boundary occurring in a downward trending issue are considered to be in a potential distribution zone.
• Prices extending outside of a relatively wide R-Reversion Channel boundary, greater than 100 or lower than 0, may warrant a more cautious price continuation approach.
• A relatively narrow R-Reversion Channel often favors a strong directional breakout.
Plot Information
| Number | Name | Default Color | Description |
| Plot1 | RRev Upper Boundary | Red | Plots the upper R-Reversion Channel boundary as a line. |
| Plot2 | User-defined Upper Boundary | Red | Plots the upper inner user-defined R-Reversion Channel boundary as a dotted line. |
| Plot3 | RRev Mid-Line | Teal | Plots the average (midline) of the R-Reversion Channel as a dashed line. |
| Plot4 | RRev Lower Boundary | Green | Plots the lower R-Reversion Channel boundary as a line. |
| Plot5 | User-defined Lower Boundary | Green | Plots the inner lower user-defined R-Reversion Channel boundary as a dotted line. |
| Plot6 | Reading: R-Reversion Channel | Red/Green | Plots R-Reversion Channel assessments on the chart and in the data window. |
| Plot7 | R-Reversion Ratio | Red/Green | Plots the numeric value of the R-Reversion Ratio on the chart. |
When applied to a chart, this indicator displays five line plots. The upper R-Reversion boundary, the inner upper user-defined boundary, an optional channel center line, the lower R-Reversion boundary and the inner lower user-defined boundary. The indicator also plots the R-Reversion Ratio and assessment information on the chart (optional) and in the data window.
Reversion Dollar Calculations
Rondeau’s Reversion uses Reversion Dollars for its intensity-based measurements and indicator calculations.
Reversion Dollars (or Reversion Dollar Volume) is a modified version of standard dollar volume, providing an extremely close approximation of a bar’s total dollar activity.
Reversion Dollars are calculated as: Volume * ( (High + Low + Open + Close) / 4 )