 Relative Strength (Indicator)
Input Information
| Name | Expression | Default | Description |
| ReferenceSymbol | String |
|
The reference symbol to be compared to the current symbol. |
| Length | Numeric | 10 | Number of bars over which percent change is calculated. |
| NumDecimalsOfPrecision | Numeric | 3 | The number of decimals of precision used to determine if the values are equal. Values must be between 0 and 6. |
| BelowZeroColor | Numeric | Red | The color for the difference plot when the plot value is less than zero. |
| AboveZeroColor | Numeric | Yellow | The color for the difference plot when the plot value is greater than zero. |
| LoadedStateColor | Numeric | DarkGreen | The color for the plot of the data provider state if the state is loaded. |
| NotLoadedStateColor | Numeric | DarkRed | The color used for the plot of the data provider state if the state is NOT loaded. |
Market Synopsis
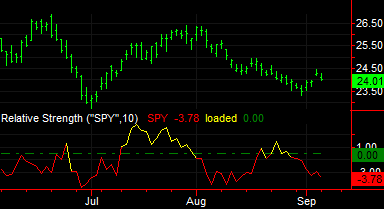
The Relative Strength indicator calculates the difference in percentage change (relative strength) between the current symbol and a reference symbol over a specified number of bars. A positive difference plots in yellow line above the zero line and a negative difference plots in red below the zero line.
The Relative Strength indicator makes use of a PriceSeriesProvider component that accesses price data for a reference symbol so that it does not require a multi-data chart and so it will work in a grid application.
This indicator does not work with tick bars, volume bars, or advanced bars.
Plot Information
| Number | Name | Chart Color | Description |
| Plot1 | RefSym | Yellow/Red | Shows the name of the reference symbol. |
| Plot2 | Diff | Yellow/Red | Plots the difference in the relative strength percentages. |
| Plot3 | DataState | Yellow | Plots the load state of the reference symbol data provider. |
| Plot4 | ZeroLine | DarkGreen | Plots the a line at zero to delimit positive and negative values. |
Related