 Rate of Deviation (Indicator)
Input Information
| Name | Expression | Default | Description |
| Price | Numeric | Close | Value used in rate of deviation calculations. |
| Length | Numeric | 20 | Bars over which to calculate the rate of deviation value. |
| BaseLevel | Numeric | 100 | Value used as the baseline for the indicator. |
| ColorCellBGOnAlert | TrueFalse | True | True to change the background color of a grid cell when an alert occurs (see following input); otherwise False to not color cell. |
| BackgroundColorAlertCell | Numeric | DarkGray | The background color value for a grid cell when an alert occurs (see previous input) |
Market Synopsis
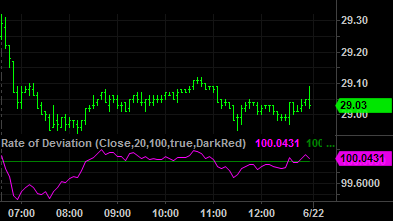
The Rate of Deviation indicator calculates and displays the amount the current price varies above or below the average price over Length bars. A deviation value greater than the base level indicates that the current price is higher than the price average while a deviation less than the base level indicates that the current price is lower than the price average. It is available for Chart Analysis and RadarScreen.
Alert Criteria
When enabled, an alert will occur when the Rate of Deviation crosses over or under the BaseLevel. In RadarScreen, a message will be shown in the CROSS BASE column indicating the type of cross.
Plot Information
| Number | Name | Default Color | Description |
| Plot1 | RateOfDev | Yellow | Plots the rate of deviation value. |
| Plot2 | BaseLevel | Green | Plots the reference base line that indicates where the price and average price are the same. |
| Plot3 | CROSS BASE | Cyan | Displays a message (grid only) when an alert occurs because the rate of deviation value crosses over or under the base level. |
When applied to a chart, this indicator displays one plot and one reference line in a separate subgraph from the price data.