 Rate of Chg (Indicator)
Input Information
| Name | Expression | Default | Description |
| Price | Numeric | Close | Price used in calculating the Rate Of Change. |
| Length | Numeric | 14 | Number of bars to include for the Rate of Change calculation. |
| AlertLength | Numeric | 14 | Number of bars to determine the alert criteria. |
| ColorNormLength | Numeric | 14 | Number of bars over which to normalize the indicator for gradient coloring. |
| UpColor | Numeric | Cyan | Color to use for indicator values that are relatively high over ColorNormLength bars. Set to -1 to disable gradient color plotting. |
| DnColor | Numeric | Magenta | Color to use for indicator values that are relatively low over ColorNormLength bars. Set to -1 to disable gradient color plotting. |
| GridForegroundColor | Numeric | Black | Color to use for numbers in RadarScreen cells when gradient coloring is enabled, that is, when both UpColor and DnColor are set to non-negative values. |
Market Synopsis
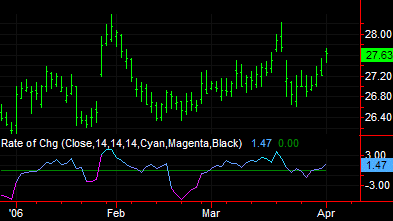
The Rate of Change indicator calculates and plots the net change, expressed as a percent, between a bar's price
Plot Information
| Number | Name | Default Color | Description |
| Plot1 | ROC | Cyan/Magenta | Plots the Rate of Change as a line. |
| Plot2 | ZeroLine | Dark Green | Plots a reference line at zero. |
When applied to a chart, this indicator displays two plots in a separate subgraph from the price data.
Set either UpColor and/or DnColor to -1 to disable gradient plot coloring. When disabled, Plot1 color is determined by settings in indicator properties dialog box. Plot2 (ZeroLine) color always comes from indicator properties dialog box.