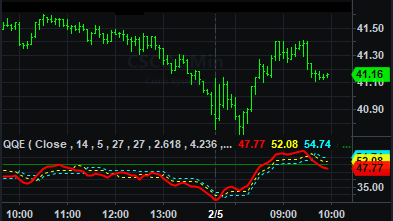
 QQE (Indicator)

Input Information
| Name | Expression | Default | Description |
| RSIPrice | Numeric | Close | Price used in calculation of QQE. |
| RSILength | Numeric | 14 | Number of bars to include in the calculation. |
| RSISmoothLength | Numeric | 5 | The length of the exponential moving average of the RSI. This value determines the smoothing factor used in the exponential moving average calculation |
| ATRLength | Numeric | 27 | The length of the exponential moving average of the true range of the smoothed RSI. |
| ATRSmoothLength | Numeric | 27 | The length of the exponential moving average of the moving average of the true range of the smoothed RSI.. |
| FastATRMulti | Numeric | 2.618 | Fast trendline scaling factor that is multiplied by the moving average of the moving average of the true range of the smooth RSI. |
| SlowATRMulti | Numeric | 4.236 | Color used when RSI is above the OverBought level. |
| SmoothRSIAlertLevel | Numeric | 50 | If alerts are enabled for the indicator, an alert will be triggered if the smoothed RSI crosses the level specified by this input |
Market Synopsis
The QQE (Quantitative Qualitative Estimation) indicator is based on Welles Wilder’s RSI. QQE is based on a smoothed RSI value that is plotted. The absolute value of the change in smoothed RSI values from bar to bar is calculated and averaged twice. This double-smoothed value is then multiplied by two user-specified constants to create two additional lines (FastTL and SlowTL) that are also plotted.
As a trending indicator, look for the SmoothRSI to cross above or below the 50 level. As an oscillator, much like the RSI it is based on, look for overbought or oversold conditions. Generally greater than 70 is considered overbought, while values less than 30 are considered oversold.
Divergence is another way to use QQE by looking for divergences between the QQE momentum and price momentum.
Plot Information
| Number | Name | Default Color | Description |
| Plot1 | SmoothRSI | Red | Plots the RSI value. |
| Plot2 | FastTL | Yellow | OverBought reference line. |
| Plot3 | SlowTL | Cyan | OverSold reference line. |
When applied to a chart, this indicator displays three plots in a separate subgraph from the price data.